Diagnosing Slow D365 CE Plugins: Find the Bottleneck and Cut Save Delays
Introduction
A record save starts taking longer after a D365 CE plugin is added. The plug-in looks like the obvious cause, but its code may not be where most of the wait occurs.
The delay can come from the browser, network, Dataverse pipeline, data requests, or an external service. A useful diagnosis separates plug-in run time from the full user wait, then targets the slowest stage.
Start by repeating the action, tracing meaningful steps, and checking the execution path. Make one focused change at a time, then rerun the same test to see whether it helped.
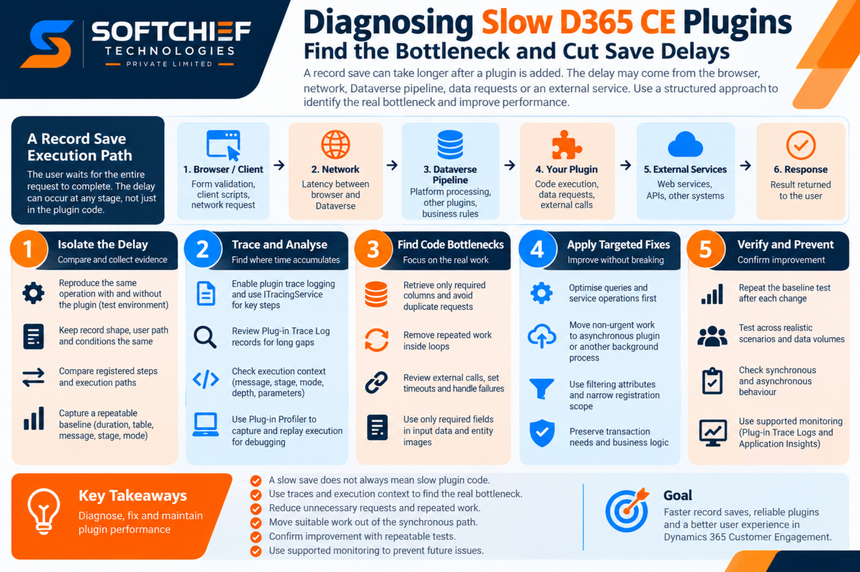
Diagnose slow D365 CE plugins by isolating the delay
A slow form or save does not prove that a plug-in is slow. The request may include client work, other registered steps, and platform processing before the user sees a result.
Compare the same operation with and without the plug-in
Reproduce the same action with the same record shape, user path, and environment conditions. Compare the registered plug-in steps and their execution paths, not just the source code you suspect.
If you can safely disable a step in a test environment, compare results with it enabled and disabled. Change one factor per test; one slow save is not enough to identify the cause.
Separate synchronous wait time from background processing
A synchronous plug-in runs as part of the operation the user is waiting for. An asynchronous step runs independently of that immediate interaction, through the Dataverse asynchronous service.
Moving non-urgent work to an asynchronous step can improve perceived response time without reducing the total work. The work may finish later, and queue delays can affect when it completes, so check whether the business process allows that timing.
Capture a repeatable baseline
Record the action, table, message, plug-in step, stage, execution mode, and approximate duration. Note relevant conditions too, such as record size, user path, and whether the issue happens every time.
Repeat comparable tests and keep the results together. This helps distinguish a steady bottleneck from an intermittent delay caused by a remote service or other changing conditions.
Trace slow D365 CE plugins to find where time accumulates
Use evidence from the full execution path before editing code. Dataverse trace logs and targeted timing messages can show which parts of your plug-in ran and where a pause began.
Use plug-in trace logs to inspect execution
Enable plug-in trace logging during the investigation, then use ITracingService to record key stages. Add messages before and after data retrieval, external calls, and major branches rather than logging every line.
Review the resulting Plug-in Trace Log records for the order of events and any long gaps. Microsoft notes that trace logs use organization storage, so turn logging off when troubleshooting ends. See Microsoft’s plug-in tracing and logging guidance.
Read the execution context for clues
Check the message, primary table, stage, execution mode, depth, correlation details, and input parameters. These values can reveal an unexpected step, a repeated execution, or a different path than the one you intended to test.
Compare the context across slow and normal runs. If the registered step fires more often than expected, review its registration and conditions before changing its code.
Reproduce and inspect execution with the Plug-in Profiler
The Plug-in Profiler can capture a plug-in execution context and replay it during local debugging. Use the captured data to inspect which inputs and branches the plug-in received.
Profiling is useful for understanding behavior, but debugging adds overhead. Don’t treat a duration measured in a debug session as a production performance benchmark. Microsoft explains capture and replay in its plug-in debugging documentation.
Find code patterns that slow D365 CE plugins
Once traces point to plug-in code, inspect the work it performs. Repeated requests and waits on remote systems often matter more than small changes to calculations.
Reduce unnecessary Dataverse requests
Retrieve only the columns the plug-in uses, and avoid fetching the same record more than once. For each query or update, ask whether it is needed for this execution path.
Trace messages around each service call can help show where the time goes. Also check that the query returns only the needed records. Microsoft’s plug-in and business logic best practices recommend retrieving only needed data.
Avoid repeated work inside loops
A service call inside a loop can multiply the work for a single plug-in execution. For example, retrieving a related record separately for every item may repeat the same lookup many times.
Look for repeated queries, calculations, and updates. Gather required data efficiently, reuse results where it is safe, and avoid processing records that do not affect the outcome.
Review external calls and oversized execution data
A synchronous network request makes the user wait for the external service, which can add both delay and variation. If the call is required, set a timeout and check the connection behavior; Microsoft’s best-practice guidance covers both.
Also review entity images and input data. Request only the attributes the plug-in reads, rather than passing large sets of unused data into each execution.
Make targeted changes without creating new problems
Base each fix on trace evidence. A smaller query or a removed duplicate request is safer than changing several registrations and code paths at once.
Optimize queries and service operations first
Start by trimming retrieved columns, removing duplicate requests, and simplifying work that runs on every execution. After each change, confirm that the plug-in still reads and writes the right data.
Check transaction needs before changing how records are read or updated. A faster path that alters expected data behavior can create a larger business problem.
Move suitable work out of the synchronous path
Work that does not need to finish before the save succeeds may fit an asynchronous plug-in or another supported background process. Examples can include a follow-up action or a remote notification, if the business process permits it.
This moves the user’s wait, not necessarily the total processing time. Confirm how the process handles delays, failures, and retries before moving work.
Preserve correctness while limiting plug-in scope
Review registered messages, stages, filtering attributes, and step conditions. Microsoft recommends filtering attributes because an update step without them can run on every update message.
Avoid broad registration changes without checking other users of the step and its transaction needs. A narrowly scoped plug-in reduces unnecessary executions while preserving the intended behavior.
Verify the improvement and prevent regressions
A fix needs a before-and-after comparison. Use the baseline to confirm that the costly stage changed, then check that the full user action improved too.
Repeat the baseline test after each change
Run the same operation under comparable conditions. Compare the overall duration and the trace stages that pointed to the bottleneck.
Change one major factor at a time so the result stays clear. If the plug-in stage gets faster but the user still waits, investigate the client, platform, or service portions of the request.
Check behavior across realistic scenarios
Test more than the record that exposed the issue. Include relevant messages, data volumes, user paths, and edge cases.
Confirm that synchronous errors still stop the operation when needed. For asynchronous work, check that jobs complete as expected and meet the business timing requirement.
Use supported monitoring and documentation
Use Plug-in Trace Logs for focused troubleshooting, and turn them off when you finish. For longer-term telemetry, review Microsoft’s Application Insights integration for plug-ins, which supports monitoring plug-in behavior over time.
Consult current Microsoft documentation for tracing, the event pipeline, the profiler, and Application Insights. A single timing result can’t guarantee future performance under different data or service conditions.
Conclusion
Diagnosing slow D365 CE plugins starts with locating the delay, not guessing at the code. Compare repeatable tests, trace meaningful stages, and use the execution context to confirm which step ran.
Fix the costly work your evidence identifies, especially unnecessary requests or repeated processing. Move work out of the synchronous path only when the business process allows it, then rerun the baseline and test real user scenarios.