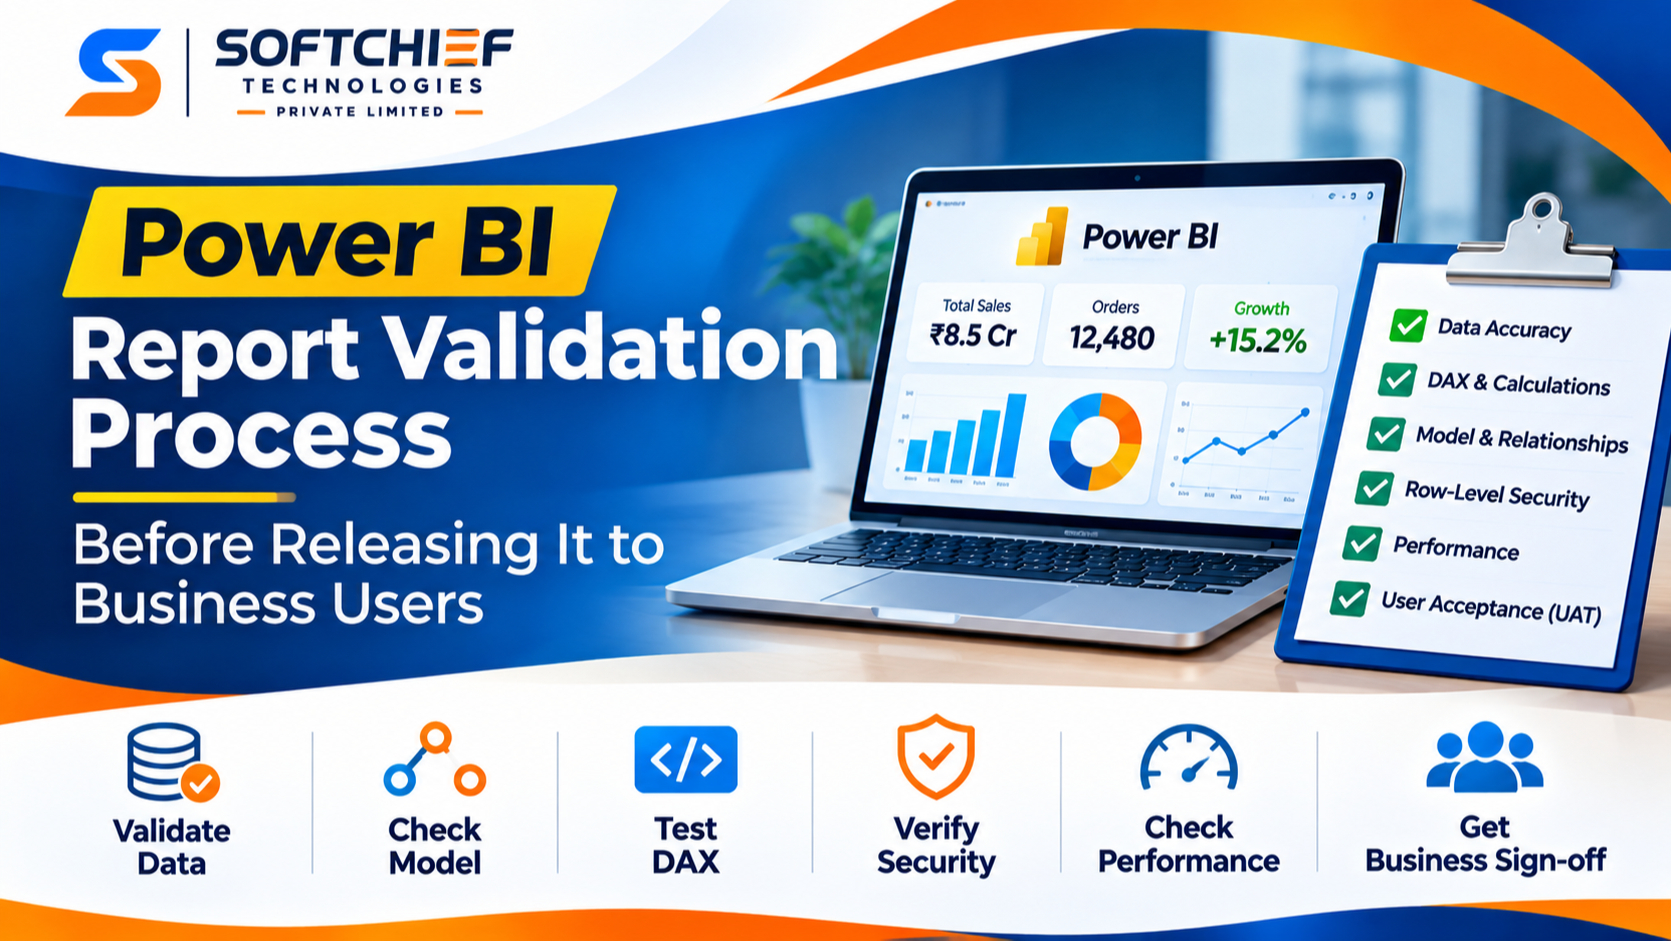
Power BI: How to Design a Report Validation Process Before Releasing It to Business Users
Introduction
A Practical Guide to Data Accuracy, DAX Testing, Security Validation, Performance, and Enterprise BI Release Management
A Power BI report can look perfect during development and still create serious problems after it reaches business users.
Imagine a sales director opening a newly released Power BI dashboard on Monday morning. The revenue KPI shows ₹8.5 crore, but the finance team’s monthly report shows ₹7.9 crore. The regional sales manager can see figures belonging to another region. A slicer changes the product chart but does not update the corresponding revenue calculation. Another user reports that the report takes almost 40 seconds to load.
The development team has published the report successfully. The visuals are rendering. The semantic model is connected. There are no obvious errors.
But can the report actually be trusted?
This is an important distinction in enterprise Power BI development.
A report being technically available does not mean it is functionally correct, secure, performant, or ready for business use.
Before releasing a Power BI report, developers and BI teams must establish a structured validation process that checks the entire reporting solution, from source data and Power Query transformations to the semantic model, DAX measures, visual interactions, security, and production deployment.
In this article, we will explore how to design that validation process using practical Power BI scenarios and implementation techniques.
Whether you are a Power BI developer, BI analyst, data engineer, solution architect, student, or fresher preparing for a real-world BI project, understanding report validation will help you build reports that business users can confidently depend on.
1. Why Is Power BI Report Validation Important?
Power BI reports are frequently used to support important business decisions.
Examples include:
- Sales performance and revenue forecasting.
- Financial reporting and expense monitoring.
- Customer acquisition and retention analysis.
- Inventory and supply chain management.
- Employee productivity reporting.
- Operational performance monitoring.
A mistake in a report can affect more than its appearance.
An incorrect aggregation can lead to misleading financial figures. An incorrectly configured relationship can produce duplicated totals. A missing security rule can expose confidential information. A poorly optimized measure can make an otherwise useful report difficult to use.
Consider a retail organization with the following reporting requirements:
| Business requirement | Expected report behavior |
|---|---|
| Sales performance | Display accurate sales revenue |
| Regional analysis | Show sales by business region |
| Product analysis | Calculate revenue by product category |
| Monthly reporting | Display correct monthly trends |
| Regional security | Restrict users to their authorized regions |
| Management dashboard | Load within an acceptable response time |
The development team creates the report and validates it using its own account.
Everything appears correct.
However, the report has not yet been tested with regional users, finance users, or business managers.
This is where the validation process becomes important.
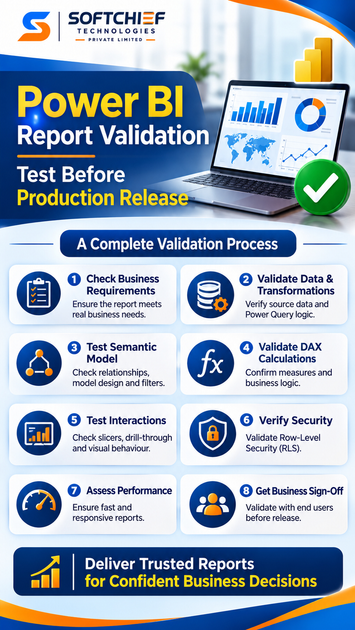
A proper validation strategy must answer five questions:
- Is the underlying data correct?
- Are calculations and business rules correct?
- Does the report behave correctly under different filters and interactions?
- Is the information accessible only to authorized users?
- Can the report perform reliably in the production environment?
Only when these questions have satisfactory answers should the report move to business users.
2. Understand the Different Layers of Power BI Report Validation
Before creating a validation checklist, it is useful to understand the architecture of a Power BI reporting solution.
A typical Power BI implementation contains several connected layers.
Layer 1: Data sources
Data may originate from SQL Server, Excel, SharePoint, Dataverse, APIs, Azure services, or other enterprise systems.
Layer 2: Power Query transformations
Data is cleaned, filtered, merged, appended, and transformed before loading into the semantic model.
Layer 3: Semantic model
Tables, relationships, hierarchies, calculated columns, measures, and security rules determine how data is interpreted.
Layer 4: Report presentation
Visuals, slicers, filters, drill-through pages, bookmarks, tooltips, and interactions present information to users.
Layer 5: Power BI Service
The published solution operates with production credentials, gateways, refresh schedules, workspace permissions, and sharing configurations.
Layer 6: Business consumption
Users interact with the report, interpret results, export information where permitted, and make business decisions.
A validation process that checks only the report visuals ignores several important areas.
For example, a chart may display the correct-looking number because the sample dataset contains only a small number of records. However, when the production dataset contains millions of rows, a relationship issue or incorrect aggregation may become visible.
Therefore, validation must happen across the complete reporting architecture.
3. Step One: Validate Business Requirements Before Testing the Report
One mistake I frequently see in reporting projects is that developers begin validating visuals before confirming what the business actually expects.
This creates unnecessary rework.
Imagine the business asks for a monthly revenue report.
The developer creates a measure:
Total Revenue =
SUM ( Sales[Revenue] )
Technically, this measure is valid.
But what does the business mean by revenue?
Does it include:
- Cancelled orders?
- Returned products?
- Discounts?
- Taxes?
- Pending transactions?
- Only completed sales?
If the business definition is not clear, the report may be technically correct but functionally incorrect.
Create a business requirement validation matrix
Before testing the report, convert each requirement into a measurable validation condition.
| Requirement | Validation condition |
|---|---|
| Total revenue | Matches the approved finance calculation |
| Monthly sales | Uses the correct transaction date |
| Regional performance | Applies the correct region mapping |
| Product ranking | Sorts using the approved revenue measure |
| Customer count | Counts unique customers, not transactions |
| Previous month comparison | Uses the agreed comparison period |
| User access | Restricts information according to assigned permissions |
The business analyst, report developer, and business owner should agree on these definitions.
This becomes the reference document for report testing.
Expert recommendation: Never use the visual appearance of a report as the primary acceptance criterion. Validate the business definition behind every important KPI.
4. Step Two: Validate Source Data and Power Query Transformations
A Power BI report cannot be more reliable than the data feeding it.
Before testing measures or visuals, validate the data pipeline.
Consider a sales dataset containing:
- Order ID
- Customer ID
- Product ID
- Order Date
- Region
- Quantity
- Unit Price
- Discount
- Net Revenue
The development team imports the data using Power Query.
During transformation, it performs the following operations:
- Removes unnecessary columns.
- Changes data types.
- Removes invalid records according to agreed business rules.
- Merges product information.
- Standardizes regional names.
- Creates calculated transformation columns.
Every transformation introduces a potential validation requirement.
4.1 Validate record counts
Suppose the source SQL table contains 125,000 eligible sales transactions.
After Power Query transformations, the resulting fact table contains 123,400 records.
That difference must be explained.
Were 1,600 records intentionally excluded?
Were duplicate records removed?
Did a merge operation eliminate unmatched rows?
A developer should not simply assume that fewer records mean cleaner data.
For important datasets, compare source and destination counts using the same filters and business definitions.
4.2 Check for duplicate business keys
If the sales transaction ID is expected to be unique, validate that assumption.
Example SQL:
SELECT
    OrderID,
    COUNT(*) AS RecordCount
FROM dbo.Sales
GROUP BY OrderID
HAVING COUNT(*) > 1;
This identifies duplicate order IDs.
However, make sure the business key is actually expected to be unique. A single order may legitimately contain multiple product lines.
The validation rule must reflect the source system’s actual data grain.
4.3 Validate null values and data types
Check:
- Missing customer IDs.
- Invalid dates.
- Null transaction amounts.
- Incorrect currency formats.
- Unexpected text values in numeric columns.
- Invalid regional mappings.
A column containing numeric-looking text can create problems in aggregations and relationships.
For example, 1001 stored as text is not equivalent to a properly typed integer key in every modelling scenario.
4.4 Validate joins and merges
Power Query merge operations can introduce duplicate records or remove unmatched rows depending on the join type.
For example, joining a sales fact table with a product table using a non-unique product key may increase the number of resulting records.
Always check the row count before and after important merges.
Also validate unmatched keys.
A missing product mapping should be investigated rather than silently ignored.
4.5 Understand query folding
Query folding is another important consideration.
When supported transformations are translated into the source system’s query language, Power Query can delegate processing to the source.
However, certain transformations may prevent folding or change where processing occurs.
For large enterprise datasets, verify that the intended transformations are efficient and that refresh performance is acceptable.
Microsoft documentation: Query folding in Power Query.
5. Step Three: Validate the Power BI Semantic Model
A report can contain correct source data and still produce incorrect results because of semantic model problems.
This is one of the most important areas of Power BI report validation.
The semantic model defines how tables relate to each other and how business calculations are evaluated.
5.1 Validate table relationships
Consider a simple sales model:
- Sales
- Product
- Customer
- Date
- Region
A typical star schema would look like this:
<escape> Date | | Customer —— Sales —— Product | | Region </escape>
The Sales table contains transactional data, while the other tables provide descriptive attributes.
Validate:
- Primary key uniqueness on dimension tables.
- Correct relationship cardinality.
- Appropriate filter direction.
- Active and inactive relationships.
- Missing or unmatched foreign keys.
- Consistent fact table grain.
For example, a Product dimension should normally have one row per product key.
If the dimension contains duplicate product keys, the intended one-to-many relationship may not work as expected.
Microsoft recommends star schema modelling for Power BI semantic models because dimension tables support filtering and grouping, while fact tables support summarization.
Reference: Understand star schema and its importance for Power BI.
5.2 Validate relationship behavior
Suppose the report contains a sales amount measure:
Total Sales =
SUM ( Sales[NetRevenue] )
When a user selects a product category, the sales measure should reflect transactions associated with that category.
Test:
- Product category filtering.
- Customer filtering.
- Region filtering.
- Date filtering.
- Cross-filtering between visuals.
If the result does not change as expected, investigate the relationship path and filter propagation.
Do not immediately modify the DAX measure to compensate for a relationship problem.
5.3 Validate inactive relationships
Power BI models can contain inactive relationships when multiple date columns or business relationships exist.
For example, a sales table may contain:
- OrderDate
- DeliveryDate
- InvoiceDate
The active relationship might use OrderDate.
If the business wants to analyze sales by delivery date, the measure may require USERELATIONSHIP.
Example:
Sales by Delivery Date =
CALCULATE(
    [Total Sales],
    USERELATIONSHIP(
        Sales[DeliveryDate],
        'Date'[Date]
    )
)
Validate that the measure produces the correct result when the date dimension filters delivery dates.
This is especially important when a report contains multiple date-based KPIs.
6. Step Four: Validate DAX Measures Against Independent Expected Results
DAX validation should be treated as a separate testing activity.
A measure can return a number without returning the correct business result.
For example:
Total Sales =
SUM ( Sales[NetRevenue] )
This measure is straightforward, but more complex business calculations require additional attention.
Consider the following measures.
6.1 Total sales
Total Sales =
SUM ( Sales[NetRevenue] )
Expected behavior:
- Returns the correct total.
- Responds correctly to region filters.
- Responds correctly to date filters.
- Responds correctly to product selections.
6.2 Total orders
Total Orders =
DISTINCTCOUNT ( Sales[OrderID] )
Why use DISTINCTCOUNT?
Because a single order may contain multiple product lines.
Counting transaction rows would produce a different result from counting unique orders.
6.3 Average order value
Average Order Value =
DIVIDE(
    [Total Sales],
    [Total Orders],
    0
)
Validate the result against an independent calculation.
For example:
Total Sales = ₹50,00,000
Total Orders = 1,000
Expected Average Order Value = ₹5,000.
6.4 Previous month sales
Previous Month Sales =
CALCULATE(
    [Total Sales],
    DATEADD(
        'Date'[Date],
        -1,
        MONTH
    )
)
Validate:
- Month selection.
- Year boundaries.
- Missing dates.
- Partial months.
- Date table configuration.
The date dimension should be properly designed for the time intelligence requirements.
6.5 Month-over-month growth
MoM Growth % =
VAR CurrentSales =
    [Total Sales]

VAR PreviousSales =
    [Previous Month Sales]

RETURN
    DIVIDE(
        CurrentSales - PreviousSales,
        PreviousSales
    )
Test the following cases:
| Current sales | Previous sales | Expected result |
|---|---|---|
| 120,000 | 100,000 | 20% |
| 90,000 | 100,000 | -10% |
| 100,000 | 0 | Blank or agreed business treatment |
| 100,000 | Blank | Agreed business treatment |
Notice the last two cases.
The development team must decide what should happen when the comparison period has no sales.
Returning zero, blank, or an alternative business message are different reporting decisions.
The expected behavior should be documented.
6.6 Validate totals and subtotals
One particularly important area is total-row behavior.
A measure that produces correct individual row values does not necessarily produce the expected grand total.
For example, an average of individual customer averages is not always equal to the overall average.
Similarly, percentage calculations should generally be evaluated from their underlying numerator and denominator rather than by summing displayed percentages.
Validate both:
- Individual visual rows.
- Subtotals and grand totals.
Practical recommendation: Keep a separate DAX validation sheet containing the measure name, test filters, expected result, actual result, and test status.
7. Step Five: Validate Filters, Slicers, Drill-Through, and Visual Interactions
Power BI reports are interactive applications.
Business users do not simply view charts. They apply filters, select categories, navigate pages, drill into details, and compare information.
Therefore, visual interaction testing is essential.
Consider a sales dashboard with:
- Sales by region.
- Sales by product.
- Monthly revenue trend.
- Top 10 customers.
- Total sales KPI.
- Date slicer.
- Region slicer.
When a user selects the South region, every relevant visual should respond according to the defined business requirements.
What should be tested?
Slicer validation
- Does the date slicer filter all relevant visuals?
- Does the region slicer filter the correct data?
- Are slicer selections retained across pages where intended?
- Does the report behave correctly with multiple selections?
Visual interaction validation
- Does selecting a bar in one chart filter or highlight other visuals correctly?
- Are visual interactions configured intentionally?
- Are any visuals accidentally excluded from filtering?
Drill-through validation
- Does the user navigate to the correct detail page?
- Are the selected filter values passed correctly?
- Does the detail page display the expected records?
Bookmark validation
- Does each bookmark display the correct report state?
- Are data and display settings configured correctly?
- Does navigation work consistently?
Tooltip validation
- Does the tooltip display the correct measure?
- Are the values consistent with the selected data point?
- Is important information available without depending exclusively on hover interactions?
A useful approach is to maintain an interaction test matrix.
| Test | Action | Expected behavior |
|---|---|---|
| INT-01 | Select South region | South region data appears |
| INT-02 | Select March | March figures are displayed |
| INT-03 | Select product category | Related sales visuals update |
| INT-04 | Drill through customer | Correct customer details appear |
| INT-05 | Clear filters | Default report state returns |
Test the actual user journey, not just individual visuals.
8. Step Six: Validate Row-Level Security Before Publishing
Security validation is not optional in enterprise Power BI reporting.
Consider an organization operating across four regions:
- North
- South
- East
- West
Each regional manager should see only the sales data belonging to their assigned region.
A national sales director should have access to all regions.
The report may work correctly for the developer, but that does not prove that it works correctly for the intended business users.
8.1 Implement dynamic Row-Level Security
A common approach is to maintain a security mapping table.
Example:
| UserEmail | Region |
|---|---|
| manager1@company.com | North |
| manager2@company.com | South |
| manager3@company.com | East |
| manager4@company.com | West |
A dynamic security role can use the USERPRINCIPALNAME() function.
Example DAX filter expression on the security table:
SecurityUsers[UserEmail] =
USERPRINCIPALNAME()
The relationship between the security table and the Region dimension must be configured so that the filter propagates correctly to the sales fact table.
Validate the model’s filter paths and test the actual user identities.
8.2 Use Test as role
In Power BI Desktop, use View as to test defined roles.
After publishing, use the Power BI Service’s Test as role functionality to validate the security behavior.
Check:
- Does the North manager see only North records?
- Does the South manager see only South records?
- Does the national director see all authorized regions?
- Does a user with no mapping receive the expected restricted result?
- Does dynamic security return the correct identity?
There is an important security consideration that developers must understand.
RLS applies to users with Viewer permissions in a workspace. It does not restrict workspace Admin, Member, or Contributor roles in the same way.
Therefore, workspace role assignments must also be reviewed.
A report with perfectly configured RLS can still expose information if users receive excessive workspace permissions.
Microsoft reference: Row-level security in Power BI.
9. Step Seven: Validate Report Performance Before Release
A report that takes too long to load can reduce business adoption, even when its calculations are correct.
Performance testing should be included in the release process.
Imagine a management dashboard containing:
- 12 report visuals.
- Multiple slicers.
- Complex DAX calculations.
- A large transaction table.
- Several cross-filter interactions.
The report takes 25 seconds to render.
The development team may assume that the issue is related to the volume of data.
But that is only one possible reason.
Other causes include:
- Inefficient DAX expressions.
- Poor model relationships.
- High-cardinality columns.
- Too many visuals on a page.
- Expensive visual interactions.
- Inefficient source queries.
- DirectQuery source latency.
- Capacity or concurrency constraints.
9.1 Use Power BI Performance Analyzer
Power BI provides Performance Analyzer to investigate the time taken by individual visuals.
In Power BI Desktop:
- Open the report.
- Navigate to the View tab.
- Select Performance Analyzer.
- Start recording.
- Refresh the visuals.
- Review the individual visual timings.
- Expand a visual to examine its performance breakdown.
- Copy the DAX query where available for further investigation.
Performance Analyzer provides useful information about visual load durations and separates categories such as DAX query execution and other processing time.
This helps identify whether the problem is associated with a particular visual or its underlying query.
Reference: Use Performance Analyzer to examine report performance.
9.2 Review expensive DAX calculations
For example, a measure that performs repeated row-by-row calculations over a very large fact table may need optimization.
Review:
- Unnecessary iterators.
- Repeated calculations.
- Complex filter expressions.
- Unnecessary context transitions.
- High-cardinality filtering.
- Inefficient relationship usage.
Use DAX Studio or other appropriate tools when deeper query-plan and server-timing analysis is required.
9.3 Reduce unnecessary visuals
Every visual introduces rendering and query overhead.
Avoid filling a single page with too many charts simply because there is available space.
Ask whether each visual contributes to a business decision.
If not, remove it or move it to a supporting detail page.
9.4 Test production-like data volumes
A report tested against 5,000 sample rows may behave very differently when it operates against 20 million production records.
Validate using representative data volumes and the intended storage mode.
Performance expectations should be agreed with the business team rather than based on an arbitrary universal loading-time target.
10. Step Eight: Validate Data Refresh, Gateways, and Production Configuration
A report can pass every Desktop test and still fail after publication.
Why?
Because Power BI Desktop and the Power BI Service operate in different deployment environments.
Production validation must include the configuration required for the report to operate reliably.
10.1 Validate semantic model refresh
Check:
- Is the correct production data source configured?
- Are the credentials valid?
- Is the refresh schedule correct?
- Does the refresh complete successfully?
- Are incremental refresh policies behaving as expected?
- Is the refreshed data consistent with the source?
For example, if the finance team expects data through 31 March but the semantic model contains records only through 29 March, the report may be technically functional but business users will receive incomplete information.
10.2 Validate on-premises data gateways
If the semantic model connects to an on-premises SQL Server or other supported data source, verify:
- Gateway availability.
- Correct gateway cluster or configuration.
- Data source mapping.
- Credentials.
- Network connectivity.
- Scheduled refresh execution.
Do not consider gateway validation complete simply because the data source is visible in the configuration.
Perform an actual refresh test.
10.3 Validate deployment environments
A mature BI release process should separate:
- Development.
- Test.
- UAT.
- Production.
Power BI deployment pipelines can help move content through development, test, and production stages.
Before promoting content, verify the relevant deployment rules, parameters, data source connections, and environment-specific configuration.
Also distinguish report content deployment from data validation. A successful deployment does not prove that the production semantic model contains correct and complete business data.
Microsoft reference: Power BI implementation planning – Deploy content.
11. Step Nine: Validate Usability and Accessibility with Business Users
A report is designed for people to use, not just for developers to demonstrate.
Technical accuracy is essential, but business usability matters equally.
Consider a report that contains 15 charts, 10 slicers, several technical labels, and multiple colors.
It may contain all the required information, but a business manager might struggle to identify the most important KPI.
Validate:
Business readability
- Are KPI names understandable?
- Are units and currencies clearly displayed?
- Are percentages formatted correctly?
- Are negative values represented consistently?
- Are date ranges visible?
Navigation
- Can users move between report pages easily?
- Are buttons and bookmarks intuitive?
- Can users return to the overview page?
Accessibility
- Are visual titles and alternative text meaningful?
- Is the contrast sufficient?
- Is information communicated through more than color alone?
- Can users navigate using a keyboard?
- Is the tab order logical?
- Are screen-reader users able to understand the report?
Power BI supports accessibility capabilities such as keyboard navigation, screen-reader compatibility, high-contrast themes, and alternative text for visuals.
Accessibility should be included during report design and validation rather than added after the report has already been released.
Reference: Design Power BI reports for accessibility.
12. Build a Repeatable Power BI Report Validation Process
Now let’s bring everything together.
Instead of relying on informal testing, establish a documented validation workflow.
A practical enterprise process can be divided into six stages.
Stage 1: Requirement validation
The business analyst and report developer confirm:
- KPI definitions.
- Calculation rules.
- Expected filters.
- Business dimensions.
- Security requirements.
- Performance expectations.
- Acceptance criteria.
Exit condition: Business requirements are documented and approved.
Stage 2: Data and model validation
The developer checks:
- Source record counts.
- Data types.
- Missing values.
- Duplicate keys.
- Transformation logic.
- Relationship cardinality.
- Filter propagation.
- Model structure.
Exit condition: Data and semantic model validation is complete.
Stage 3: Calculation validation
The team tests:
- DAX measures.
- Aggregations.
- Time intelligence.
- Percentage calculations.
- Totals and subtotals.
- Blank and zero scenarios.
- Business-specific calculations.
Exit condition: Important calculations match independently verified expected results.
Stage 4: Functional validation
Test:
- Slicers.
- Filters.
- Cross-highlighting.
- Drill-through.
- Bookmarks.
- Tooltips.
- Navigation.
- Export behavior where applicable.
Exit condition: Required user interactions work correctly.
Stage 5: Security and performance validation
Test:
- RLS roles.
- Actual user identities.
- Workspace permissions.
- Visual performance.
- Semantic model performance.
- Refresh operations.
- Gateway connectivity.
Exit condition: Security and operational requirements are satisfied.
Stage 6: UAT and release approval
Business users validate the report against their actual reporting requirements.
The team collects feedback, records defects, resolves critical issues, and obtains release approval.
Exit condition: The designated business owner accepts the report for production use.
13. Practical Power BI Report Validation Checklist
Use the following checklist before releasing a Power BI report to business users.
Data validation
- Source and destination record counts are reconciled.
- Data types are correct.
- Duplicate records are investigated.
- Missing and invalid values are reviewed.
- Power Query transformations are validated.
- Merge and append operations are tested.
- Data refresh completeness is confirmed.
Semantic model validation
- Table relationships are correct.
- Relationship cardinality is validated.
- Filter direction is reviewed.
- Active and inactive relationships are tested.
- Fact table grain is consistent.
- Dimension keys are unique where required.
- Measures are validated against expected results.
Functional validation
- KPI calculations are correct.
- Slicers behave correctly.
- Cross-filter interactions are tested.
- Drill-through works.
- Bookmarks work as intended.
- Tooltips display correct values.
- Totals and subtotals are validated.
Security validation
- RLS roles are tested.
- Dynamic security is validated.
- User-to-role mappings are correct.
- Workspace permissions are reviewed.
- Sharing and export permissions are reviewed.
Performance validation
- Performance Analyzer is reviewed.
- Slow visuals are investigated.
- DAX calculations are optimized where necessary.
- Representative data volumes are tested.
- Refresh performance is acceptable.
Production validation
- Production data sources are configured.
- Credentials are valid.
- Gateway connectivity is confirmed where required.
- Refresh schedules are tested.
- Deployment configuration is reviewed.
- UAT approval is obtained.
- Business users receive release communication.
14. Automating Power BI Report Validation
For organizations managing multiple reports and semantic models, manual validation alone can become difficult to maintain.
This is where automation becomes valuable.
A mature BI development process can include automated validation checks within its source-control and deployment workflow.
Microsoft’s Power BI implementation guidance describes validation pipelines that can perform quality checks before content is published.
Examples include:
- Running Best Practice Analyzer checks against semantic models.
- Running DAX queries against published semantic models.
- Checking model metadata.
- Recording validation results.
- Preventing content from progressing when required checks fail.
A practical implementation can use tools such as:
- Power BI Desktop and Power BI Service.
- Power BI Project (PBIP) source-control workflows.
- Tabular Editor and Best Practice Analyzer.
- DAX Studio for query investigation.
- XMLA endpoints where supported by the relevant capacity and permissions.
- Azure DevOps or GitHub Actions for CI/CD orchestration.
- Power BI REST APIs for supported administrative and deployment operations.
Example: Automated measure validation
Suppose the finance team expects the sales total for a controlled test dataset to be ₹5,00,000.
A DAX query can retrieve the measure value from the semantic model:
EVALUATE
ROW(
    "ActualSales",
    [Total Sales]
)
The result can be compared with an independently calculated expected value in the validation pipeline.
Conceptually:
Expected Sales = 500000

Actual Sales = Execute DAX Query

IF Actual Sales = Expected Sales
    Validation = PASS
ELSE
    Validation = FAIL
For real implementations, the query must run against a controlled test dataset or a precisely defined filter context.
Do not hardcode production business totals into tests that will become invalid as new transactions arrive.
A better approach is to use stable test fixtures, approved reporting periods, or independently generated expected results.
Also remember that a successful DAX query does not automatically validate visual layout, RLS behavior, or the complete end-user experience. Those require their own tests.
Microsoft reference: Power BI implementation planning – Deploy content.
15. Common Power BI Report Validation Mistakes
Even experienced Power BI developers can miss important issues when they are working under release deadlines.
Here are some mistakes worth avoiding.
Mistake 1: Validating only the visuals
A visually correct report can still contain incorrect data, relationships, or calculations.
Mistake 2: Testing everything with the developer account
The developer may have broader access than business users. Always validate the actual security experience.
Mistake 3: Ignoring totals and subtotals
A measure may look correct at the row level but produce unexpected grand totals.
Mistake 4: Using only sample data
Small datasets can hide performance and data-quality problems that become visible in production.
Mistake 5: Skipping production refresh validation
A report that works in Desktop may fail because of production credentials, gateway configuration, or source connectivity.
Mistake 6: Treating successful deployment as business approval
Deployment success and business acceptance are two separate things.
Mistake 7: Ignoring accessibility
A report should be understandable and usable by the widest practical audience.
Mistake 8: Releasing without a documented validation record
When issues appear later, the team should be able to identify what was tested, who approved it, and which version was released.
16. Final Thoughts: A Power BI Report Must Be Trusted Before It Is Released
Building a Power BI report is not just about creating attractive visuals or writing DAX measures.
A production-ready reporting solution requires a structured engineering process.
The team must validate the source data, transformation logic, semantic model, calculations, security, report interactions, performance, and production configuration.
More importantly, the report must satisfy the business requirements for which it was created.
A good validation process protects organizations from inaccurate reporting, incorrect business decisions, security problems, and unnecessary production support issues.
For Power BI developers, the ability to validate a report systematically is just as important as the ability to build one.
Remember: A Power BI report is not ready for release when the developer says it is finished. It is ready when the data is accurate, the calculations are verified, access is secure, performance is acceptable, and the business users can trust the results.
Frequently Asked Questions (FAQs)
1. What is Power BI report validation?
Power BI report validation is the process of checking data accuracy, semantic model relationships, DAX calculations, visual interactions, security, performance, and production readiness before releasing a report to business users.
2. Why is Power BI report testing important?
It helps identify incorrect calculations, missing data, security issues, performance problems, and functional defects before they affect business decisions.
3. How do you validate DAX measures in Power BI?
Compare measure results against independently calculated expected values using controlled datasets and filter contexts. Test totals, subtotals, blank values, zero values, and different slicer combinations.
4. How do you test Row-Level Security in Power BI?
Use View as in Power BI Desktop and Test as role in Power BI Service. Verify that each intended user sees only the data authorized by their assigned role. Also review workspace permissions.
5. What tools can be used for Power BI report validation?
Useful tools include Power BI Desktop, Power BI Service, Performance Analyzer, DAX Studio, Tabular Editor, Best Practice Analyzer, and appropriate CI/CD tools.
6. What should be checked before publishing a Power BI report?
Validate business requirements, source data, Power Query transformations, relationships, DAX calculations, filters, RLS, performance, accessibility, refresh configuration, and UAT approval.
7. Can Power BI report validation be automated?
Yes. Teams can automate semantic model quality checks, DAX query tests, metadata checks, and deployment validation using supported tools and CI/CD workflows. Functional and business acceptance testing should also be retained.
8. What is the difference between Power BI report validation and UAT?
Technical report validation checks whether the report functions correctly according to its specifications. User Acceptance Testing checks whether the report meets the actual needs of business users. Both are necessary before production release.
Strengthen Your Power BI Development Skills with Softchief Learn
Creating a Power BI report is the starting point. Building a report that performs reliably in a real enterprise environment requires a deeper understanding of data modelling, DAX, Power Query, security, optimization, and deployment practices.
At Softchief Learn, we focus on practical Microsoft technology training that helps students, freshers, and working professionals develop skills they can apply in real-world projects.
Explore our Microsoft Power BI and related technology training programmes to strengthen your technical knowledge and implementation capabilities.
Learn beyond visuals. Understand the data. Build reports that business users can trust.
Explore Softchief Learn Courses: Visit our courses page.
Want to know which training programme is suitable for your experience level? Connect with our trainer, Sanjay Prakash Pradhan (Microsoft MVP), through WhatsApp for course details.