
Business Central Reporting with Power BI: Complete Guide to Building Powerful Business Insights
Introduction
In today’s competitive business environment, organisations need more than traditional financial reports and operational data. Decision-makers require real-time insights, interactive dashboards and predictive analytics to understand performance and respond quickly to changing market conditions.
Microsoft Dynamics 365 Business Central provides organisations with a powerful ERP platform to manage finance, sales, purchasing, inventory, projects and operations. However, while Business Central stores valuable business data, many organisations need advanced reporting capabilities to transform this data into meaningful insights.
This is where Microsoft Power BI integration with Business Central becomes a game changer.
By combining the transactional power of Dynamics 365 Business Central with the advanced analytics capabilities of Power BI, organisations can create interactive dashboards, monitor key performance indicators (KPIs) and make data-driven decisions.
This complete guide explores how Business Central reporting with Power BI works, key benefits, integration approaches, best practices and real-world business scenarios.
What is Business Central Reporting with Power BI?
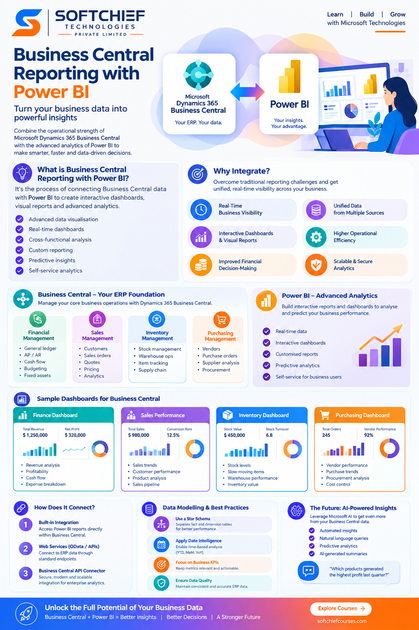
Business Central reporting with Power BI refers to the process of connecting Microsoft Dynamics 365 Business Central data with Power BI to create advanced analytics, visual reports and interactive dashboards.
While Business Central provides built-in reports for operational and financial management, Power BI extends these capabilities by enabling:
- Advanced data visualisation
- Real-time dashboards
- Cross-functional analysis
- Custom reporting
- Predictive insights
- Self-service analytics
Together, Business Central and Power BI help organisations move from traditional reporting to intelligent business analytics.
Understanding Microsoft Dynamics 365 Business Central
Microsoft Dynamics 365 Business Central is a cloud-based ERP solution designed for small and medium-sized enterprises.
It helps businesses manage:
Financial Management
Includes:
- General ledger
- Accounts payable
- Accounts receivable
- Cash flow management
- Budgeting
- Fixed assets
Sales Management
Supports:
- Customer management
- Sales orders
- Quotes
- Pricing
- Customer analytics
Inventory Management
Provides capabilities for:
- Stock management
- Warehouse operations
- Item tracking
- Supply chain visibility
Purchasing Management
Enables:
- Vendor management
- Purchase orders
- Supplier analysis
- Procurement processes
Business Central acts as the central system of record, while Power BI transforms this operational data into strategic insights.
Why Integrate Business Central with Power BI?
Many organisations struggle with traditional reporting methods because:
- Reports are manually prepared
- Data exists in multiple systems
- Decision-makers lack real-time visibility
- Analysis requires technical expertise
Power BI integration solves these challenges by creating a unified analytics platform.
Key Benefits Include:
1. Real-Time Business Visibility
Power BI dashboards provide executives and managers with up-to-date information about business performance.
Examples:
Finance teams can monitor:
- Revenue trends
- Profit margins
- Expense analysis
- Cash flow position
Sales teams can analyse:
- Sales pipeline
- Customer performance
- Product profitability
Operations teams can track:
- Inventory levels
- Stock movements
- Supplier performance
2. Interactive Dashboards and Visual Reports
Traditional ERP reports often provide static information.
Power BI enables interactive experiences where users can:
- Filter information
- Drill down into details
- Compare performance
- Identify trends
- Explore business patterns
For example, a finance manager can start with total revenue and drill down into:
Country → Region → Customer → Product → Transaction
This level of analysis helps businesses identify opportunities and risks quickly.
3. Improved Financial Decision-Making
Financial reporting is one of the most common use cases for Business Central and Power BI integration.
Finance teams can build dashboards showing:
Revenue Analysis
Track:
- Monthly sales growth
- Revenue by customer
- Revenue by product category
Profitability Analysis
Analyse:
- Gross profit margins
- Cost trends
- Department profitability
Cash Flow Monitoring
Monitor:
- Receivables
- Payables
- Cash availability
- Payment trends
These insights help finance leaders make better strategic decisions.
How Does Business Central Connect with Power BI?
Microsoft provides several options for connecting Business Central data with Power BI.
1. Built-In Power BI Integration
Business Central includes native Power BI capabilities.
Users can access Power BI reports directly within Business Central pages.
This provides:
- Embedded analytics
- Role-based dashboards
- Contextual reporting
For example, a customer page can display:
- Customer sales history
- Outstanding invoices
- Purchase trends
without leaving Business Central.
2. Business Central Web Services
Business Central exposes data through web services.
These include:
- APIs
- OData services
- Standard endpoints
Power BI can connect to these services and retrieve ERP data for reporting.
Common datasets include:
- Customers
- Vendors
- Items
- Sales invoices
- Purchase invoices
- General ledger entries
3. Business Central API Connector
The Business Central API allows developers and analysts to securely access ERP data.
Advantages include:
- Modern integration approach
- Better data accessibility
- Secure authentication
- Scalable reporting solutions
This approach is commonly used for enterprise analytics solutions.
Building a Power BI Dashboard for Business Central
Creating effective dashboards requires understanding business requirements first.
A successful dashboard should answer important business questions.
Example 1: Finance Dashboard
A finance dashboard may include:
Key Metrics
- Total Revenue
- Gross Profit
- Operating Expenses
- Net Profit
- Outstanding Receivables
Visualisations
- Revenue trend charts
- Expense breakdown
- Profit comparison
- Cash flow analysis
Example 2: Sales Performance Dashboard
Sales leaders can monitor:
KPIs
- Sales achievement
- Conversion rates
- Customer acquisition
- Product performance
Reports
- Sales by salesperson
- Sales by region
- Top-performing products
- Customer profitability
Example 3: Inventory Dashboard
Operations teams can analyse:
- Stock availability
- Inventory value
- Slow-moving items
- Warehouse performance
This helps reduce:
- Overstocking
- Stock shortages
- Inventory costs
Data Modelling Best Practices for Business Central Power BI Reports
Creating effective Power BI reports requires a strong data model.
1. Create a Star Schema
A recommended approach is separating:
Fact Tables
Contain measurable business transactions.
Examples:
- Sales transactions
- Purchase transactions
- General ledger entries
Dimension Tables
Contain descriptive information.
Examples:
- Customers
- Products
- Vendors
- Dates
This improves:
- Performance
- Scalability
- Report usability
2. Use Proper Date Intelligence
Business reporting requires time-based analysis.
Power BI can provide:
- Year-to-date sales
- Month-over-month growth
- Quarterly comparison
- Previous year analysis
A proper date table improves accuracy.
3. Create Business-Focused KPIs
Avoid creating dashboards filled with unnecessary information.
Focus on metrics that support decision-making.
Examples:
Finance KPIs:
- Gross margin percentage
- Days sales outstanding
- Cash position
Sales KPIs:
- Sales growth rate
- Average order value
- Customer retention
Inventory KPIs:
- Inventory turnover
- Stock availability
- Dead stock value
Power BI Reports Commonly Used with Business Central
Financial Reports
Examples:
- Income statement analysis
- Balance sheet dashboard
- Budget vs actual comparison
- Expense analysis
Sales Reports
Examples:
- Sales performance dashboard
- Customer profitability report
- Product sales analysis
Purchasing Reports
Examples:
- Vendor performance
- Purchase trends
- Procurement analysis
Inventory Reports
Examples:
- Inventory valuation
- Stock movement analysis
- Warehouse performance
Security Considerations for Business Central Power BI Reporting
Security is critical when reporting involves financial and operational data.
Organisations should implement:
Role-Based Access
Users should only see relevant information.
Example:
- Sales managers view sales data
- Finance managers view financial reports
- Warehouse managers view inventory information
Row-Level Security (RLS)
Power BI Row-Level Security ensures users see only authorised data.
Example:
A regional sales manager can view only their assigned region’s sales performance.
Data Governance
Organisations should establish:
- Data ownership
- Report approval processes
- Access policies
- Data quality standards
Real-World Example: Business Central and Power BI Implementation
A manufacturing company using Dynamics 365 Business Central faced challenges with manual reporting.
Finance teams spent several days preparing monthly reports.
Management lacked visibility into:
- Production costs
- Inventory value
- Sales performance
- Profitability
The organisation implemented Power BI dashboards connected with Business Central.
The solution provided:
- Automated financial reporting
- Real-time inventory insights
- Sales performance tracking
- Executive dashboards
Results:
- Reduced manual reporting effort
- Faster decision-making
- Improved operational visibility
- Better financial control
Best Practices for Business Central Power BI Reporting
1. Define Reporting Requirements First
Before building dashboards:
- Identify business objectives
- Understand user needs
- Select meaningful KPIs
2. Avoid Overloading Dashboards
A good dashboard should be:
- Simple
- Clear
- Action-oriented
Too much information reduces usability.
3. Maintain Data Quality
Accurate reports require accurate ERP data.
Ensure:
- Consistent master data
- Correct transaction entries
- Proper data governance
4. Train Business Users
Power BI adoption improves when users understand:
- Dashboard navigation
- Filtering techniques
- Data interpretation
5. Continuously Improve Reports
Business requirements change.
Review dashboards regularly and update:
- KPIs
- Visualisations
- Data sources
Future of Business Central Reporting with AI
The future of ERP reporting is moving towards intelligent analytics.
With Microsoft AI capabilities, organisations can benefit from:
- Automated insights
- Natural language queries
- Predictive analytics
- AI-generated summaries
Users will be able to ask questions such as:
“Which products generated the highest profit last quarter?”
or
“Why did inventory costs increase this month?”
AI-powered analytics will make Business Central reporting more accessible for business users.
Conclusion
Business Central and Power BI together create a powerful platform for modern business intelligence.
Dynamics 365 Business Central provides reliable ERP data while Power BI transforms that data into actionable insights through interactive dashboards and advanced analytics.
By implementing effective data modelling, security practices and KPI-driven reporting strategies, organisations can unlock the full value of their ERP investment.
Whether you are analysing financial performance, improving sales strategies or optimising inventory operations, Power BI reporting with Business Central helps businesses make faster, smarter and more confident decisions.