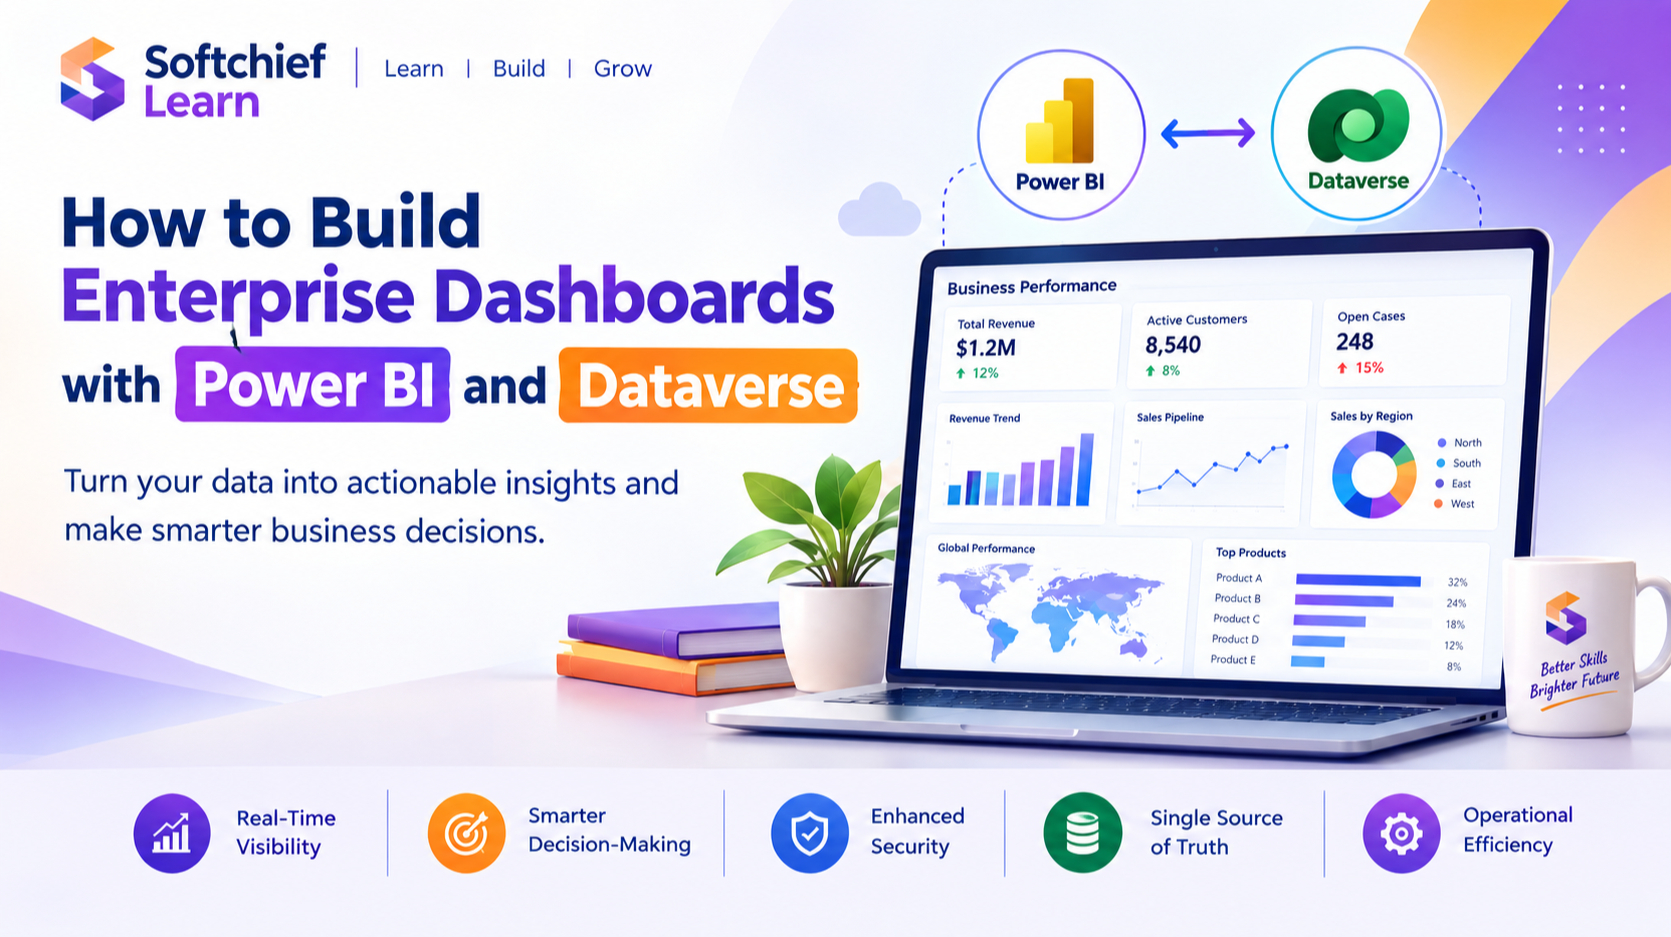
How to Build Enterprise Dashboards with Power BI and Dataverse
Introduction
In today’s competitive business environment, organisations generate enormous volumes of data from multiple systems including customer relationship management platforms, enterprise resource planning applications, operational systems and business applications.
However, having data alone does not create business value. Organisations need the ability to transform raw data into meaningful insights that support faster and smarter decision-making.
This is where Microsoft Power BI and Dataverse provide a powerful enterprise analytics foundation.
By combining Power BI’s advanced data visualisation capabilities with Microsoft Dataverse’s secure and scalable data platform, organisations can build enterprise dashboards that provide real-time visibility into business performance.
Enterprise dashboards built with Power BI and Dataverse help organisations:
- Monitor key business metrics
- Analyse operational performance
- Identify trends and opportunities
- Improve decision-making
- Create a single source of business intelligence
This comprehensive guide explores how organisations can design and build enterprise-grade dashboards using Power BI and Dataverse.
What Are Enterprise Dashboards?
An enterprise dashboard is a centralised visual reporting solution that displays critical business information in an easy-to-understand format.
Unlike traditional reports, enterprise dashboards focus on:
- Real-time insights
- Interactive analysis
- Business performance monitoring
- Data-driven decision-making
A well-designed dashboard allows executives, managers and operational teams to quickly understand what is happening across the organisation.
Examples:
A sales director can view:
- Revenue trends
- Sales pipeline
- Conversion rates
- Regional performance
A manufacturing manager can monitor:
- Production efficiency
- Machine performance
- Quality metrics
- Inventory levels
A customer service manager can analyse:
- Case volumes
- Resolution times
- Customer satisfaction scores
Understanding Microsoft Dataverse
Microsoft Dataverse is a secure cloud-based data platform that enables organisations to store and manage business data.
It is the foundation behind many Microsoft Power Platform solutions including:
- Power Apps
- Power Automate
- Power Pages
- Dynamics 365 applications
Dataverse provides:
- Structured data storage
- Security management
- Business rules
- Relationships between data entities
- Integration capabilities
Why Use Dataverse for Enterprise Analytics?
Traditional organisations often store data across multiple disconnected systems.
Examples:
- CRM systems
- ERP applications
- Excel files
- Legacy databases
- Third-party applications
This creates challenges:
- Duplicate data
- Data inconsistency
- Manual reporting
- Limited visibility
Dataverse helps create a unified business data platform.
Example:
Customer information from Dynamics 365 Sales, service records from Dynamics 365 Customer Service and operational data from Power Apps can be stored in Dataverse and analysed through Power BI.
Understanding Power BI
Power BI is Microsoft’s business intelligence and analytics platform that enables organisations to transform data into interactive dashboards and reports.
Power BI provides:
- Data modelling
- Data transformation
- Interactive visualisations
- Artificial intelligence insights
- Real-time reporting
- Collaboration features
It enables users to move from:
Data → Information → Insights → Business Decisions
Power BI and Dataverse Integration
The integration between Power BI and Dataverse creates a powerful analytics architecture.
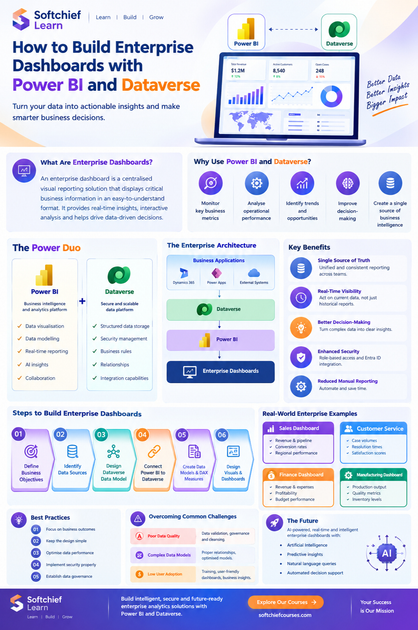
A typical enterprise architecture looks like:
Business Applications

Dynamics 365
Power Apps
External Systems

        |

     Dataverse

        |

    Power BI

        |

Enterprise Dashboards
Data flows from operational systems into Dataverse, where it is securely managed and then analysed through Power BI.
Benefits of Building Dashboards with Power BI and Dataverse
1. Single Source of Truth
One of the biggest challenges in organisations is inconsistent reporting.
Different departments may use different:
- Spreadsheets
- Reports
- Data sources
Power BI dashboards connected to Dataverse provide a unified view of business information.
Example:
Sales and finance teams can analyse revenue using the same trusted dataset.
2. Real-Time Business Visibility
Modern businesses need immediate insights.
Power BI dashboards enable organisations to monitor:
- Current sales performance
- Customer activity
- Operational issues
- Financial metrics
Decision-makers can respond quickly instead of waiting for manual reports.
3. Improved Decision-Making
Enterprise dashboards convert complex information into meaningful insights.
Instead of analysing thousands of records, managers can quickly identify:
- Trends
- Risks
- Opportunities
- Performance gaps
4. Enhanced Data Security
Dataverse provides enterprise-level security features.
Organisations can control access using:
- Security roles
- Business units
- Row-level security
- Microsoft Entra ID integration
Example:
A regional sales manager can view only data related to their assigned region.
5. Reduced Manual Reporting
Traditional reporting often requires:
- Exporting data
- Cleaning spreadsheets
- Creating presentations
Automated Power BI dashboards eliminate repetitive reporting activities.
Teams can spend more time analysing information rather than preparing reports.
Enterprise Dashboard Architecture
A successful Power BI and Dataverse implementation typically includes multiple layers.
1. Data Layer
The data layer contains business information from different sources.
Examples:
- Dynamics 365 applications
- ERP systems
- SQL databases
- Excel files
- APIs
Data is consolidated into Dataverse or connected directly through Power BI.
2. Data Modelling Layer
Data modelling defines relationships between different business entities.
Example:
Customer Data Model:
Customer

 |

Orders

 |

Products

 |

Sales Transactions
A strong data model improves:
- Performance
- Reporting accuracy
- User experience
3. Analytics Layer
Power BI transforms data into:
- Charts
- KPIs
- Dashboards
- Reports
Examples:
- Sales dashboard
- Finance dashboard
- Customer service dashboard
- Operations dashboard
4. Presentation Layer
The final dashboard provides insights to users.
Users may access dashboards through:
- Power BI Service
- Microsoft Teams
- SharePoint
- Mobile devices
Key Steps to Build Enterprise Dashboards with Power BI and Dataverse
Step 1: Define Business Objectives
Successful dashboards start with clear business goals.
Before development, identify:
- Who will use the dashboard?
- What decisions should it support?
- Which metrics matter?
Example:
A sales dashboard objective:
“Help sales managers improve pipeline visibility and revenue forecasting.”
Step 2: Identify Required Data Sources
Determine where business data exists.
Sources may include:
- Dataverse tables
- Dynamics 365 entities
- Azure services
- SQL databases
- External applications
Step 3: Design the Dataverse Data Model
A well-designed data model is essential.
Consider:
- Tables
- Relationships
- Business rules
- Data quality
Example:
Sales Data Model:
Account

Customer

Opportunity

Product

Sales Order
Step 4: Connect Power BI to Dataverse
Power BI provides native connectivity with Dataverse.
Developers can connect using:
- Dataverse connector
- Power BI dataflows
- DirectQuery
- Import mode
The correct approach depends on:
- Data size
- Performance requirements
- Reporting needs
Step 5: Create Data Models in Power BI
Power BI data modelling includes:
- Creating relationships
- Adding calculated columns
- Creating measures
- Optimising performance
Example:
A sales performance measure:
Total Revenue =
SUM(Sales[Revenue])
Step 6: Design Effective Dashboard Visuals
Good dashboards focus on clarity.
Common enterprise visuals include:
KPI Cards
Used for:
- Revenue
- Customer count
- Profit margin
Charts
Used for:
- Trends
- Comparisons
- Performance analysis
Maps
Used for:
- Regional analysis
- Location-based insights
Tables and Matrices
Used for:
- Detailed analysis
- Operational reporting
Real-World Enterprise Dashboard Examples
1. Sales Performance Dashboard
A sales organisation uses Power BI and Dataverse to monitor:
Key metrics:
- Revenue
- Pipeline value
- Won opportunities
- Sales targets
- Salesperson performance
Benefits:
- Better forecasting
- Improved sales planning
- Faster decision-making
2. Customer Service Dashboard
A customer support organisation tracks:
Metrics:
- Open cases
- Resolution time
- Customer satisfaction
- Agent performance
Managers can identify:
- Service bottlenecks
- Training requirements
- Customer trends
3. Finance Dashboard
Finance teams analyse:
- Revenue
- Expenses
- Profitability
- Budget performance
Executives gain better financial visibility.
4. Manufacturing Dashboard
Manufacturing organisations monitor:
- Production output
- Quality issues
- Inventory levels
- Equipment performance
This supports operational excellence.
Best Practices for Building Power BI Enterprise Dashboards
1. Focus on Business Outcomes
A dashboard should answer business questions.
Avoid creating dashboards filled with unnecessary charts.
2. Keep Visual Design Simple
Effective dashboards:
- Highlight important metrics
- Use consistent layouts
- Avoid information overload
3. Optimise Data Performance
Large datasets require careful design.
Best practices:
- Use proper data models
- Reduce unnecessary columns
- Optimise DAX calculations
- Use incremental refresh
4. Implement Security Properly
Use:
- Dataverse security roles
- Power BI row-level security
- Microsoft Entra ID authentication
Ensure users only access authorised information.
5. Establish Data Governance
Enterprise reporting requires governance around:
- Data ownership
- Data quality
- Dashboard standards
- Access management
Power BI, Dataverse and AI-Powered Analytics
Modern enterprise analytics is moving towards AI-driven decision-making.
Power BI integrates AI capabilities that help organisations:
- Identify trends automatically
- Detect anomalies
- Generate insights
- Forecast future performance
Example:
A business dashboard can identify declining sales patterns and highlight potential risks before they impact revenue.
Common Challenges and Solutions
Challenge 1: Poor Data Quality
Problem:
Incorrect or incomplete data affects reporting accuracy.
Solution:
Implement:
- Data validation
- Governance policies
- Data cleansing processes
Challenge 2: Complex Data Models
Problem:
Poor relationships reduce dashboard performance.
Solution:
Create:
- Proper entity relationships
- Optimised models
- Standardised structures
Challenge 3: Low User Adoption
Problem:
Users continue relying on spreadsheets.
Solution:
Provide:
- Training
- User-friendly dashboards
- Business-focused insights
Future of Enterprise Dashboards with Power Platform
The future of enterprise dashboards will be driven by:
- Artificial Intelligence
- Real-time analytics
- Predictive insights
- Natural language queries
- Automated decision support
With Microsoft Power Platform evolution, organisations will increasingly combine:
- Power BI
- Dataverse
- Power Apps
- Power Automate
- Copilot capabilities
to create intelligent business solutions.
Conclusion
Building enterprise dashboards with Power BI and Dataverse enables organisations to transform disconnected data into actionable business intelligence.
By combining Dataverse’s secure data platform with Power BI’s advanced analytics capabilities, businesses can create dashboards that provide real-time visibility, improve decision-making and drive operational efficiency.
Successful enterprise dashboards require more than attractive visuals. They require a strong data strategy, effective governance, business-focused metrics and a scalable architecture.
For organisations adopting Microsoft Power Platform, Power BI and Dataverse provide a powerful foundation for creating intelligent, secure and future-ready enterprise analytics solutions.