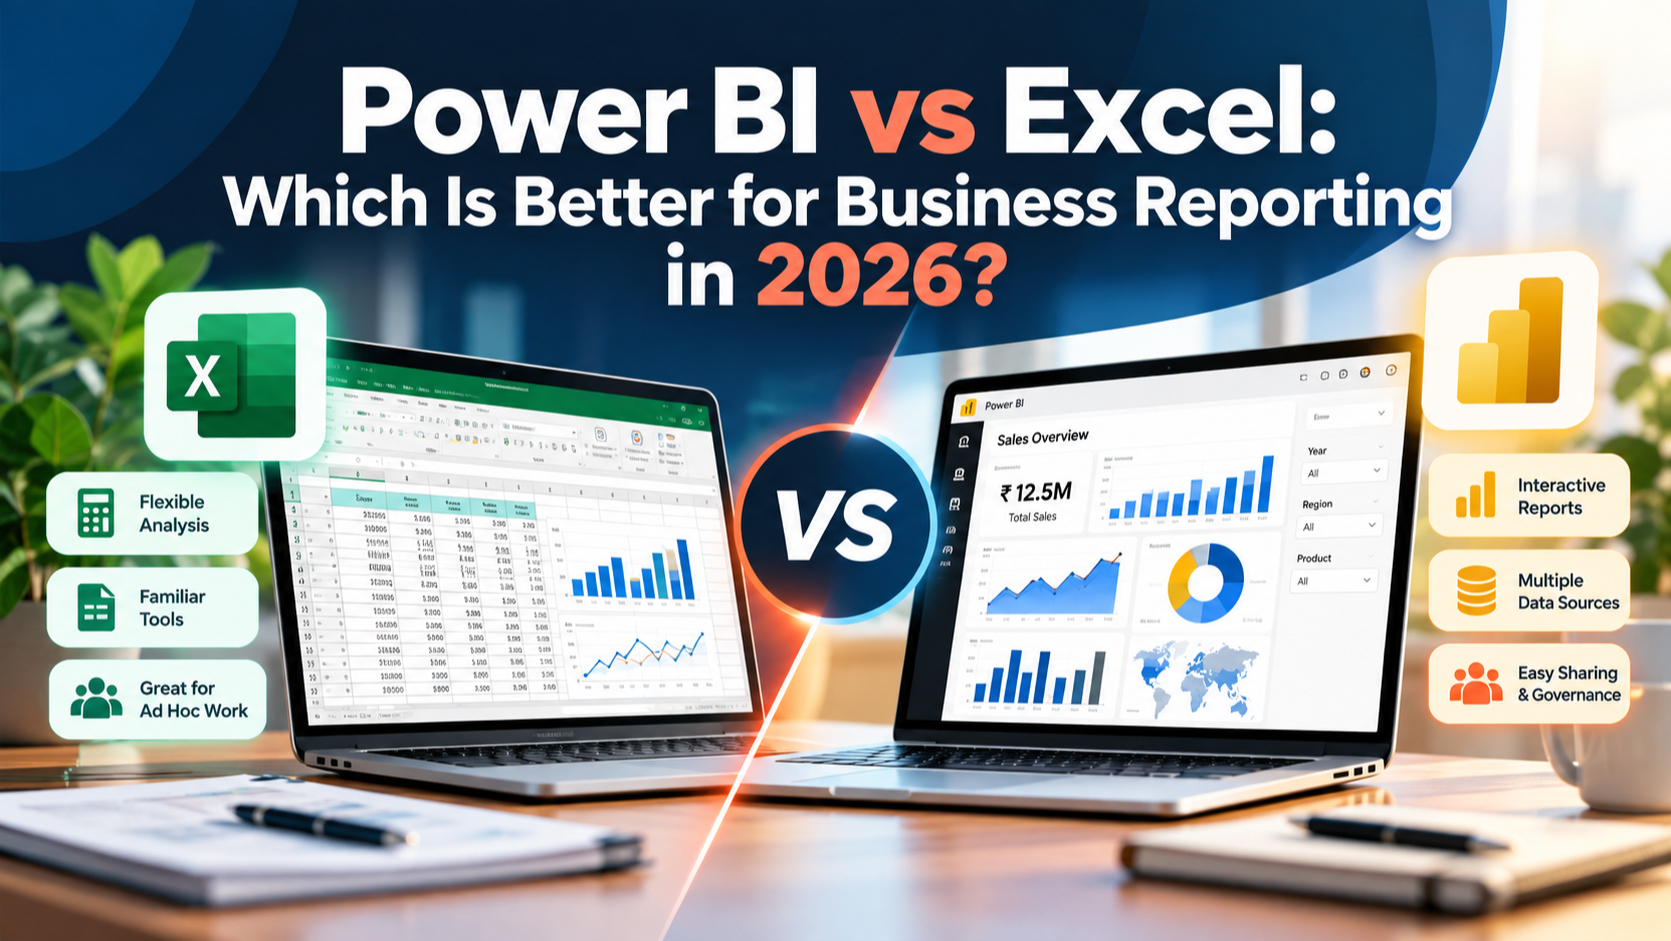
Power BI vs Excel: Which Is Better for Business Reporting in 2026?
Introduction
Your monthly sales review is due, and the figures are spread across several files. Power BI vs Excel can feel like a choice between the familiar flexibility of a spreadsheet and a tool built to connect data, model it, and share interactive reports. The better option depends on the reporting job.
Consider how complex the report is, how often it runs, who needs it, and how much control the data requires. Many teams use both: Excel for flexible analysis and Power BI for repeatable reports shared across the business.
Microsoft features and licensing can change. Before you buy or move reports in 2026, check Microsoft’s current product documentation and pricing for your location and setup.
Choose the Tool That Fits the Reporting Job
Start with the decisions people need to make, not a feature checklist. A useful reporting setup gives the right people clear, timely information they can act on.
Start with the decisions the report must support
A one-time check of sales totals may need a few formulas and a chart. A monthly review that tracks targets, compares regions, and spots changes over time may need a report people can filter and revisit.
Ask who will use the report and what decisions it should support. Also consider how often the numbers change and whether people need to explore details themselves.
Match reporting complexity to the tool
A report gets harder to maintain when it pulls from several sources, repeats the same data-cleaning steps, or uses shared KPI definitions. Drill-downs and different views for different teams add more demands.
For example, a sales report might combine orders, targets, and product data. If staff rebuild those links each month, a maintained model and repeatable data steps can reduce manual work.
Separate analysis from distribution
Building an analysis and sharing an approved report are separate tasks. One analyst may need freedom to test assumptions, while managers need a consistent view they can trust.
Decide who can view, edit, refresh, and maintain each report. That ownership plan often points to the right tool as clearly as the data itself.
Power BI vs Excel: Compare Data, Models, and Visuals
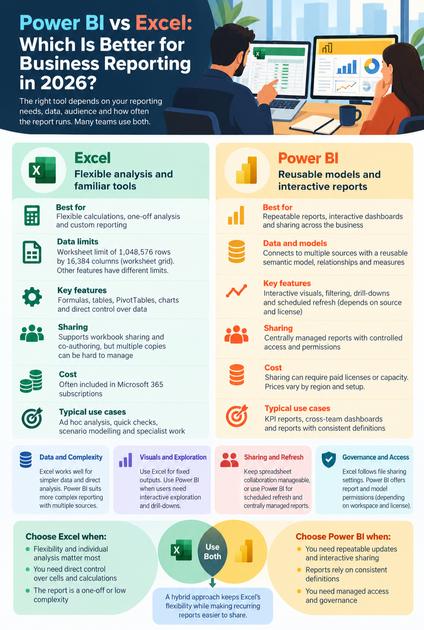
Excel and Power BI both work with data, but they support different kinds of reporting. Excel centers on worksheets and direct analysis; Power BI centers on connected data, reusable models, and interactive reports.
Use Excel for flexible calculations and familiar analysis
Excel works well for formulas, tables, PivotTables, charts, and quick analysis. People can inspect cells, change assumptions, and build a working view without first publishing a report.
Microsoft lists an Excel worksheet limit of 1,048,576 rows by 16,384 columns in its Excel specifications. That limit applies to the worksheet grid, not every workbook feature: Excel’s Data Model and overall workbook size have separate memory and system constraints.
Use Power BI for reusable models and interactive reports
Power BI can connect to multiple sources and organize data into a reusable semantic model. That model can hold relationships and measures so teams can apply shared definitions across reports.
Users can explore report visuals by filtering and drilling into relevant details. Microsoft’s Power BI refresh documentation also explains how refresh settings depend on data sources, credentials, gateways, and capacity.
Choose between fixed outputs and interactive exploration
A spreadsheet or chart can be the right format when people need a clear snapshot to review. An interactive report helps when users need to ask follow-up questions without requesting a new version.
For a regional sales report, a manager could filter by product, location, or period. If those views are part of regular review, Power BI may save time compared with maintaining separate spreadsheet versions.
Power BI vs Excel: Compare Sharing, Refresh, and Governance
The audience and report owner affect the choice as much as the analysis does. A useful report also needs a reliable way to share updates and manage access.
Keep spreadsheet collaboration manageable
Excel supports workbook sharing and co-authoring in suitable cloud setups. Still, several copies sent by email can create confusion about which file has the latest figures.
Set a source-of-truth location and name the person responsible for upkeep. A short note on data sources, refresh steps, and workbook purpose can help others avoid accidental changes.
Build repeatable reporting with controlled data flows
Power BI can support scheduled refresh and centrally managed reports, depending on the source, configuration, and license. Refresh isn’t automatic in every case: credentials may need updates, and on-premises data sources may require a gateway.
Before publishing, test the full flow from source data to report. Microsoft’s documentation covers refresh settings and limits, so check it against your own capacity and data setup.
Apply access controls and data governance
A workbook’s access often follows the file’s storage and sharing settings. Power BI offers report and model permissions managed through its service, but the exact options depend on workspace setup and licensing.
Review who can view sensitive data and who can change the report. Make access part of the reporting plan, especially when teams use different versions of the same business measure.
Compare Total Cost and Skills for Power BI vs Excel
The software fee is only part of the cost. Count setup, training, report upkeep, and the staff time spent fixing errors or rebuilding monthly files.
Check current licensing and deployment costs
Excel may already be included in a Microsoft 365 subscription, while Power BI sharing can require paid licenses or capacity, depending on how the organization publishes and distributes reports. Microsoft’s Power BI pricing page outlines plan options and notes that prices can vary by region and other factors.
Don’t base a 2026 decision on an old quote or a single per-user rate. Check current terms for report creators and viewers, then include any capacity or deployment costs that apply.
Account for maintenance, not just report creation
A workbook may be quick to build, but manual updates and copy checks can take time every month. A Power BI report needs someone to maintain connections, the model, refresh settings, and published content.
Estimate the recurring work for both approaches. A small subscription cost can be outweighed by hours spent fixing errors, while a complex reporting setup may cost more to support than it saves.
Match the tool to available skills
Most office teams already have some spreadsheet skills. Power BI adds skills such as data modeling, Power Query, DAX, and report administration.
Choose a workflow the team can maintain after launch. If the needed skills aren’t in place, include training and clear ownership in the plan.
Combine Excel and Power BI for a More Reliable Workflow
A hybrid setup can keep Excel’s flexibility while making recurring reports easier to share. It’s most useful when people need both hands-on analysis and consistent reporting; not every business needs both tools.
Keep Excel for ad hoc work and specialist analysis
Excel fits quick checks, scenario work, and tasks where people need direct control over individual cells. It’s also useful when an analyst needs to test a one-off question before deciding whether it belongs in a shared report.
Keep working files separate from approved reporting where possible. That makes it easier to see which numbers are exploratory and which ones support business decisions.
Use Power BI for recurring, shared reporting
Power BI suits refreshed KPI reports, cross-team dashboards, and reports that rely on consistent definitions. A shared model can help teams use the same measures rather than rebuilding them in separate files.
Define a handoff between the tools
A practical workflow begins with preparing and checking source data, then maintaining a model for recurring reporting. Publish the shared report in Power BI and use Excel when someone needs additional analysis.
Set a clear owner for each stage and document how data moves between tools. Microsoft supports ways to connect Excel with Power BI data, but check its current integration guidance before choosing a specific method.
Make the Right Choice for Your Business in 2026
Choose Excel when flexibility and individual analysis matter most. Choose Power BI when your reports need repeatable updates, interactive sharing, and managed access; use both when the business needs both kinds of work.
The right answer depends on the report’s purpose, data, audience, and upkeep. Start with one recurring report, map who creates and uses it, then compare the full workflow and current licensing before you commit.