Monitoring Azure Resources Using Azure Monitor and Log Analytics: A Complete Enterprise Guide
Intrroduction
Cloud adoption has transformed the way organisations build, deploy and manage applications. Businesses today run critical workloads across virtual machines, databases, containers, APIs and serverless platforms hosted on Microsoft Azure.
However, moving applications to the cloud introduces new operational challenges:
- How do you know if your applications are performing correctly?
- How can you detect failures before customers are impacted?
- How do you identify security threats?
- How can administrators analyse thousands of system events?
- How do you optimise cloud costs and resource utilisation?
The answer is effective cloud monitoring.
Microsoft Azure provides powerful monitoring capabilities through Azure Monitor and Log Analytics, enabling organisations to collect telemetry, analyse performance data, create alerts and maintain reliable cloud environments.
For Azure administrators, developers, cloud architects and DevOps professionals, understanding Azure monitoring is a fundamental skill required for managing enterprise cloud solutions.
In this article, we will explore Azure Monitor, Log Analytics, their architecture, real-world use cases and best practices for implementing enterprise-grade Azure monitoring.
What is Azure Monitor?
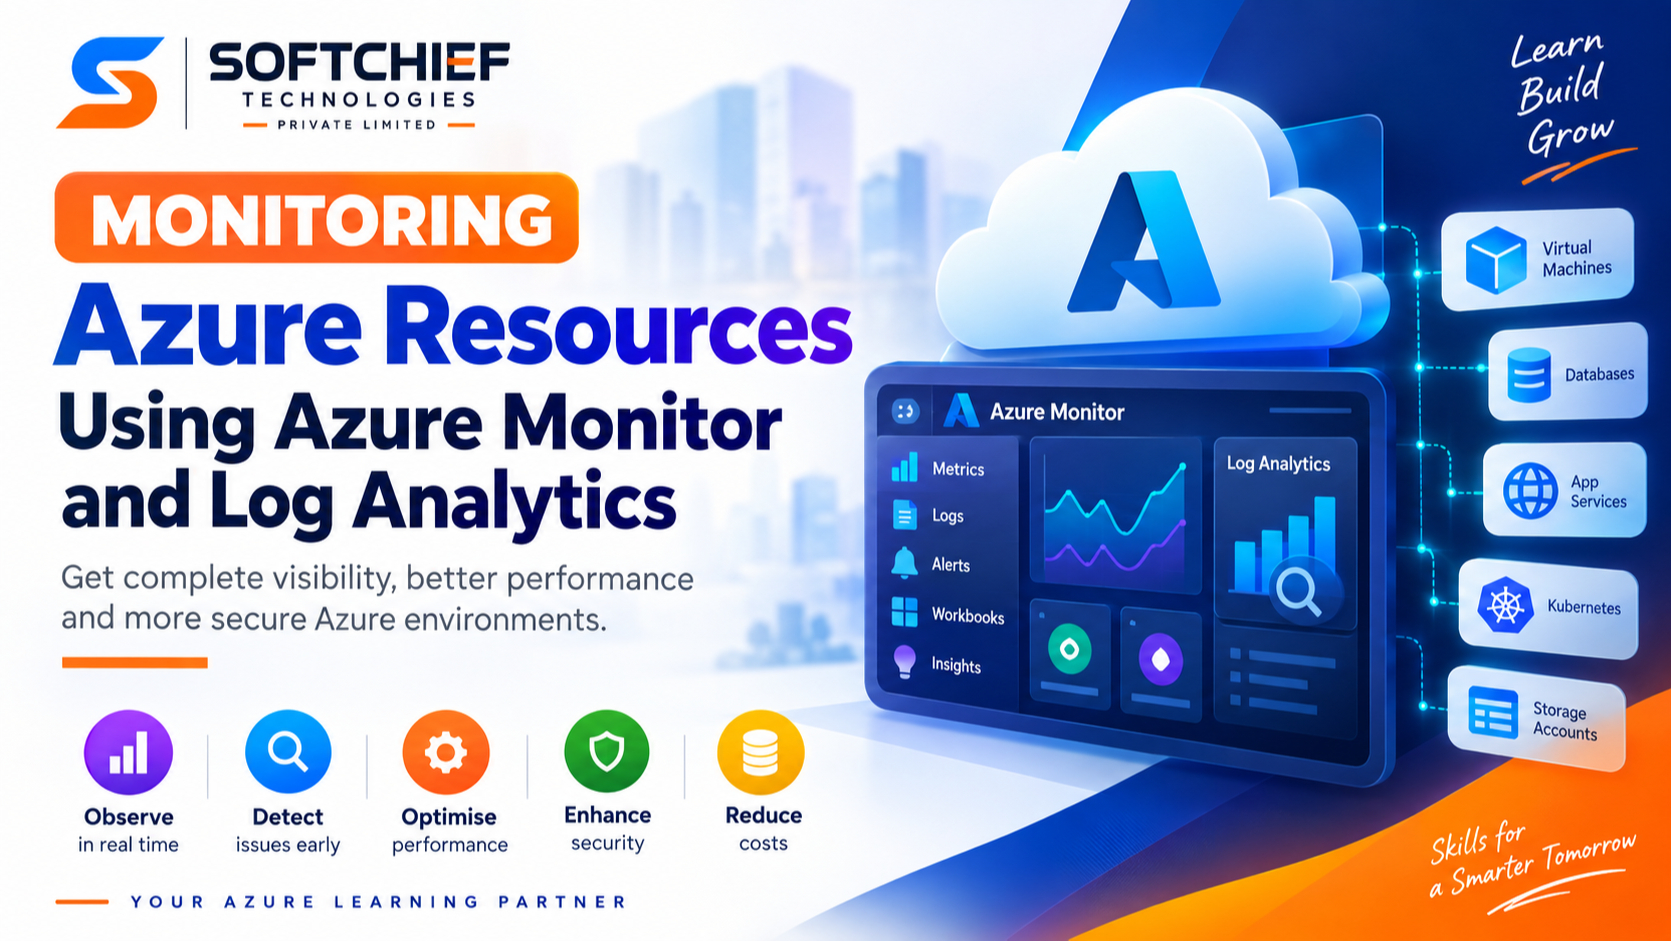
Azure Monitor is Microsoft’s unified monitoring platform designed to collect, analyse and respond to telemetry data from Azure resources, applications and infrastructure.
It provides visibility into:
- Application performance
- Infrastructure health
- Security events
- Network activity
- Database performance
- User behaviour
- Resource utilisation
Azure Monitor helps organisations move from reactive troubleshooting to proactive management.
Instead of waiting for users to report issues, teams can identify problems automatically and take corrective actions.
Why Azure Monitoring Is Important
A cloud environment can contain hundreds or thousands of resources:
Example:
Azure Subscription

 |
 |-- Virtual Machines
 |
 |-- Azure SQL Database
 |
 |-- App Services
 |
 |-- Kubernetes Clusters
 |
 |-- Storage Accounts
 |
 |-- APIs
 |
 |-- Virtual Networks
Without monitoring, administrators have limited visibility into what is happening inside these services.
Azure monitoring helps organisations achieve:
1. Improved Availability
Monitoring identifies failures quickly and reduces application downtime.
Example:
A virtual machine starts consuming excessive CPU resources.
Azure Monitor detects:
- CPU spike
- Performance degradation
- Application impact
An alert is triggered before users experience major disruption.
2. Better Performance Management
Monitoring helps analyse:
- Response times
- Memory usage
- Database performance
- Network latency
Teams can optimise applications based on real data.
3. Enhanced Security
Monitoring solutions help detect:
- Suspicious activities
- Failed login attempts
- Configuration changes
- Unusual network behaviour
Integration with Microsoft security solutions provides advanced threat detection.
4. Cost Optimisation
Azure monitoring helps identify:
- Underutilised resources
- Unnecessary workloads
- Performance bottlenecks
Example:
A development virtual machine running 24/7 but used only during business hours can be resized or automatically stopped.
Understanding Azure Monitor Architecture
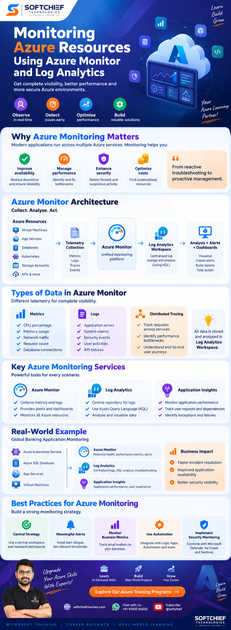
Azure Monitor collects data from multiple sources and processes it through a central monitoring platform.
High-level architecture:
Azure Resources

       |

Telemetry Collection

       |

Azure Monitor

       |

Log Analytics Workspace

       |

Analysis + Alerts + Dashboards

       |

Action / Automation
Azure Monitor Data Sources
Azure Monitor collects different types of telemetry.
The main categories include:
1. Metrics
Metrics are numerical measurements collected at regular intervals.
Examples:
- CPU percentage
- Memory usage
- Network traffic
- Request count
- Database connections
Example:
A web application receives:
10,000 requests/minute
95% CPU utilisation
200 ms response time
Metrics provide quick insights into system health.
2. Logs
Logs contain detailed information about events occurring within systems.
Examples:
- User login activities
- Application errors
- System events
- Security events
- API failures
Logs are stored and analysed using:
Azure Log Analytics Workspace
3. Distributed Tracing
Distributed tracing helps track requests across multiple services.
Example:
A customer places an online order:
Customer App

   ↓

API Gateway

   ↓

Order Service

   ↓

Payment Service

   ↓

Database
Tracing identifies where delays or failures occur.
What is Log Analytics Workspace?
A Log Analytics Workspace is a central repository where Azure monitoring data is stored, queried and analysed.
It is a key component of Azure Monitor.
It stores:
- Logs
- Performance data
- Security events
- Application telemetry
- Custom monitoring data
Why Use Log Analytics Workspace?
Enterprise environments usually have multiple Azure resources.
Instead of checking each service individually, Log Analytics provides a central monitoring location.
Example:
Without Log Analytics:
VM Logs
Database Logs
Application Logs
Network Logs

(separate locations)
With Log Analytics:
          Log Analytics Workspace

          |
 ------------------------------
 |       |        |             |
VM     SQL      App          Network
Logs   Logs     Logs         Logs
Azure Monitor Logs and Kusto Query Language (KQL)
Azure Monitor uses Kusto Query Language (KQL) to analyse log data.
KQL allows administrators and developers to:
- Search logs
- Filter events
- Identify patterns
- Create reports
- Build dashboards
Example:
Find failed requests:
requests
| where success == false
| summarize count() by name
Example:
Analyse CPU performance:
Perf
| where ObjectName == "Processor"
| summarize avg(CounterValue)
by Computer
KQL is an essential skill for Azure administrators and cloud engineers.
Monitoring Azure Virtual Machines
Virtual machines are commonly used Azure resources that require continuous monitoring.
Azure Monitor tracks:
Performance Metrics
- CPU utilisation
- Disk performance
- Memory consumption
- Network activity
Health Monitoring
- VM availability
- Agent status
- Boot diagnostics
Security Monitoring
- Login attempts
- Configuration changes
- Vulnerabilities
Monitoring Azure App Services
Azure Monitor provides visibility into web applications hosted on Azure App Service.
Monitoring includes:
- HTTP response time
- Failed requests
- Application exceptions
- Dependency failures
- Traffic patterns
Integration with:
Application Insights
provides deep application-level monitoring.
Application Insights in Azure Monitor
Application Insights is an Application Performance Management (APM) service within Azure Monitor.
It helps developers understand application behaviour.
It monitors:
- Application availability
- Exceptions
- User requests
- Dependencies
- Performance bottlenecks
Example:
A customer reports that checkout is slow.
Application Insights identifies:
Checkout API
     |
     |
Payment Service
     |
     |
Database Query (slow)
Developers can fix the actual problem instead of guessing.
Creating Alerts in Azure Monitor
Monitoring becomes valuable when it automatically responds to issues.
Azure Monitor Alerts allow organisations to create automated notifications.
Examples:
CPU Alert
Condition:
CPU > 90% for 10 minutesAction:
Send email to administratorApplication Failure Alert
Condition:
HTTP Errors > 100Action:
Create incident ticketSecurity Alert
Condition:
Multiple failed login attempts detectedAction:
Notify security teamAzure Monitor Workbooks
Azure Monitor Workbooks provide interactive dashboards for analysing monitoring data.
They allow teams to create:
- Performance dashboards
- Operational reports
- Security views
- Executive summaries
Example:
A Cloud Operations dashboard can display:
Azure Environment Health

VM Status             99.9%

Application Errors    12

Database Performance  Good

Security Alerts       0
Azure Monitor Integration with DevOps
Modern DevOps teams use monitoring as part of continuous delivery.
Azure Monitor integrates with:
- Azure DevOps
- GitHub Actions
- CI/CD pipelines
- Incident management platforms
Example workflow:
Application Deployment

        ↓

Azure Monitor Checks Health

        ↓

Performance Issue Detected

        ↓

Alert Triggered

        ↓

DevOps Team Responds
Azure Monitor vs Log Analytics: Understanding the Difference
Many professionals confuse Azure Monitor and Log Analytics.
The relationship:
| Feature | Azure Monitor | Log Analytics |
|---|---|---|
| Purpose | Complete monitoring platform | Log storage and analysis |
| Collect Metrics | Yes | Limited |
| Collect Logs | Yes | Yes |
| Query Data | Uses Log Analytics | Uses KQL |
| Alerts | Yes | Supports alerts |
| Dashboards | Yes | Supports dashboards |
Simply:
Azure Monitor is the monitoring platform.
Log Analytics is the engine used for analysing logs.
Real-World Enterprise Scenario
Global Banking Application Monitoring
A bank hosts applications on Azure:
Resources:
- Azure Kubernetes Service
- Azure SQL Database
- App Services
- Virtual Machines
Challenges:
- Application downtime risk
- Security requirements
- Performance monitoring
Solution:
Implemented:
Azure Monitor
For:
- Resource health
- Performance metrics
- Alerts
Log Analytics
For:
- Centralised logs
- KQL analysis
- Troubleshooting
Application Insights
For:
- Application performance
- User experience monitoring
Results:
- Faster incident resolution
- Improved application availability
- Better security visibility
Azure Monitoring Best Practices
1. Create a Central Monitoring Strategy
Avoid monitoring resources individually.
Use:
- Central Log Analytics Workspace
- Standard dashboards
- Common alert rules
2. Define Meaningful Alerts
Avoid alert fatigue.
Poor alert:
CPU exceeded 50%Better alert:
CPU exceeded 90% for 15 minutes3. Monitor Business Metrics
Technical monitoring alone is not enough.
Track:
- Transaction success rate
- Customer activity
- Order completion
- Revenue-impacting failures
4. Use Automation
Integrate monitoring with:
- Azure Automation
- Logic Apps
- Power Automate
- Azure Functions
Example:
When VM failure occurs:
Alert

 ↓

Logic App

 ↓

Create Ticket

 ↓

Notify Team
5. Implement Security Monitoring
Combine Azure Monitor with:
- Microsoft Defender for Cloud
- Microsoft Sentinel
This provides:
- Threat detection
- Security analytics
- Incident response
Future of Azure Monitoring
Cloud environments are becoming increasingly complex with:
- AI applications
- Microservices
- Containers
- Multi-cloud architectures
Future monitoring trends include:
- AI-powered anomaly detection
- Predictive failure analysis
- Automated remediation
- Intelligent observability
Azure Monitor continues evolving as a core component of Microsoft’s cloud management strategy.
Conclusion
Monitoring is one of the most important aspects of managing enterprise Azure environments.
Azure Monitor and Log Analytics provide organisations with powerful capabilities to collect telemetry, analyse system behaviour, detect issues and improve application reliability.
Azure Monitor provides the complete monitoring framework, while Log Analytics enables deep log analysis using powerful querying capabilities.
For Azure administrators, developers and cloud architects, mastering these services is essential for building secure, reliable and high-performing cloud solutions.
A strong Azure monitoring strategy helps businesses move from reactive troubleshooting to proactive cloud management, ensuring better performance, improved security and superior customer experiences.