Working with Monitor features in Canvas Apps Power Apps

Monitor feature inside canvas app studio helps tracing events as they occur in a canvas app during the authoring in Power Apps Studio, or you can use Monitor to debug the published version of a canvas app.
Follow the steps to monitor a scenario to know how to Monitor a canvas app while authoring.
Step 1 : Create a Canvas App and Add a Gallery
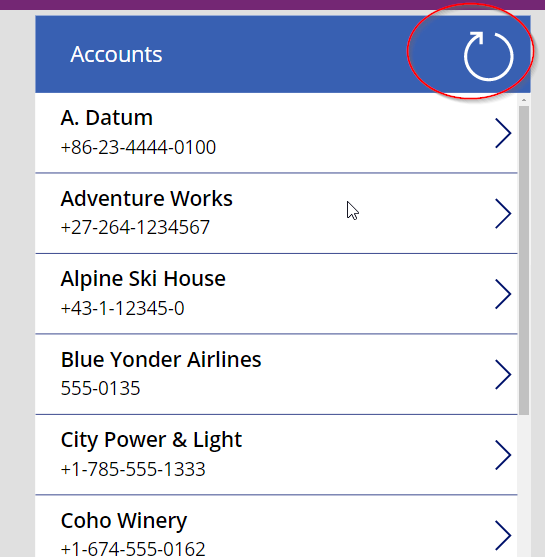
Navigate to Power Apps Solution and add a vertical gallery on to the screen. Associate Accounts table to gallery to display Accounts with a valid email and add an icon to refresh the Account table.
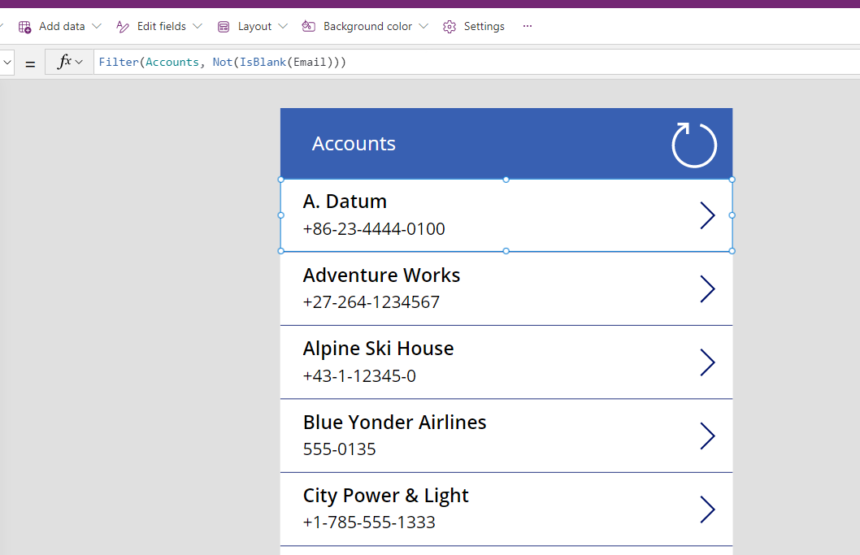
The Refresh icon reloads Accounts.
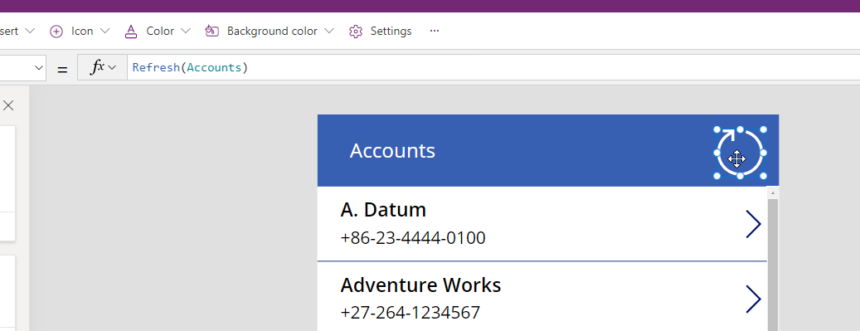
Step 2 : Open Monitor Tool and Check the Details
You can now open the Monitor tool by using monitor option.
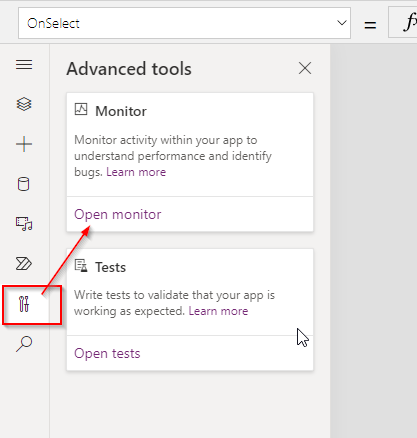
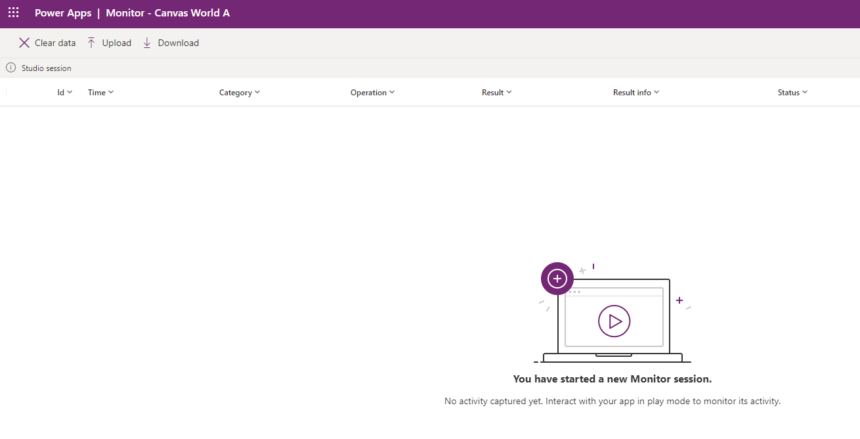
The monitor toll will open and displays no data and connect to your Power Apps studio session.
Now you can Run the Canvas App and click the Reload button to check monitor tool to capture the session data.
Now after clicking the reload button navigate to monitor screen, you will see the details. It will display Time, ID, Category, Operation, Result, Data source and Duration with other details for analysis.

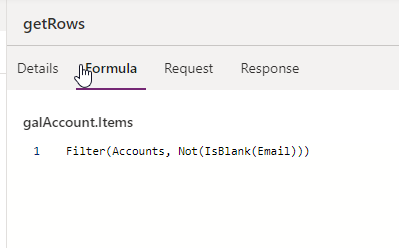
If you Click one item from the list you can see more information like Formula and details called as you clicked the button.

FORMULA – When the button reload clicked the below formula executed.
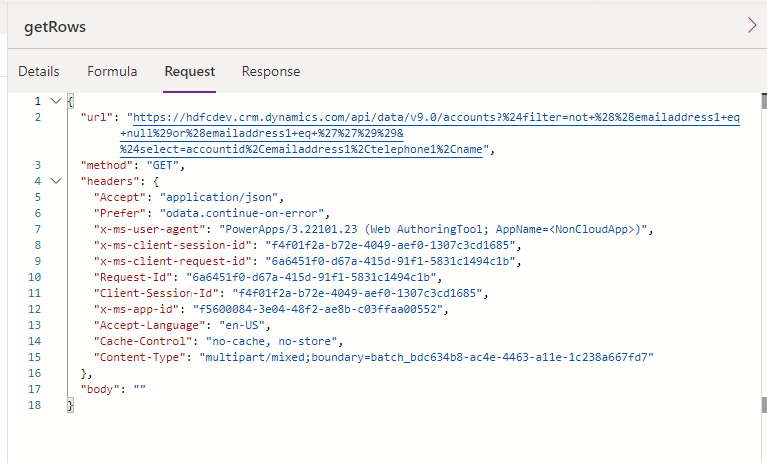
It will also display the request sent to WebAPI, Which you can check and troubleshoot. This shows the URL and Web API methods etc.
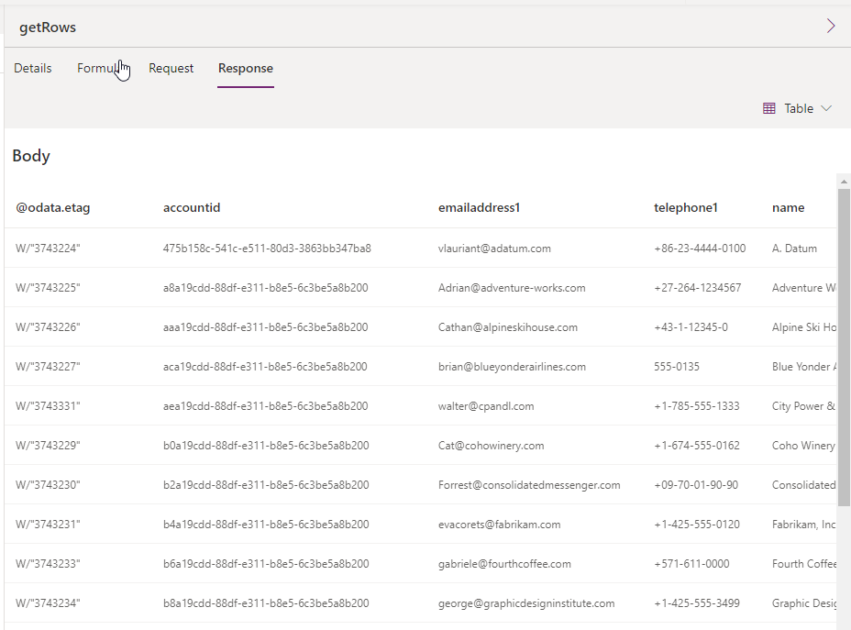
Also In Response you can see the data returned as per the request.
Hope this helps.
Follow my blog for more trending topics on Dynamics 365, Azure, C#, Power Portals and Power Platform. For training, Courses and consulting, call to us at +91 832 886 5778 I am working more for community to share skills in Dynamics 365 and Power Platform. Please support me by subscribing my YouTube Channel. My YouTube Channel link is this : https://www.youtube.com/user/sppmaestro


